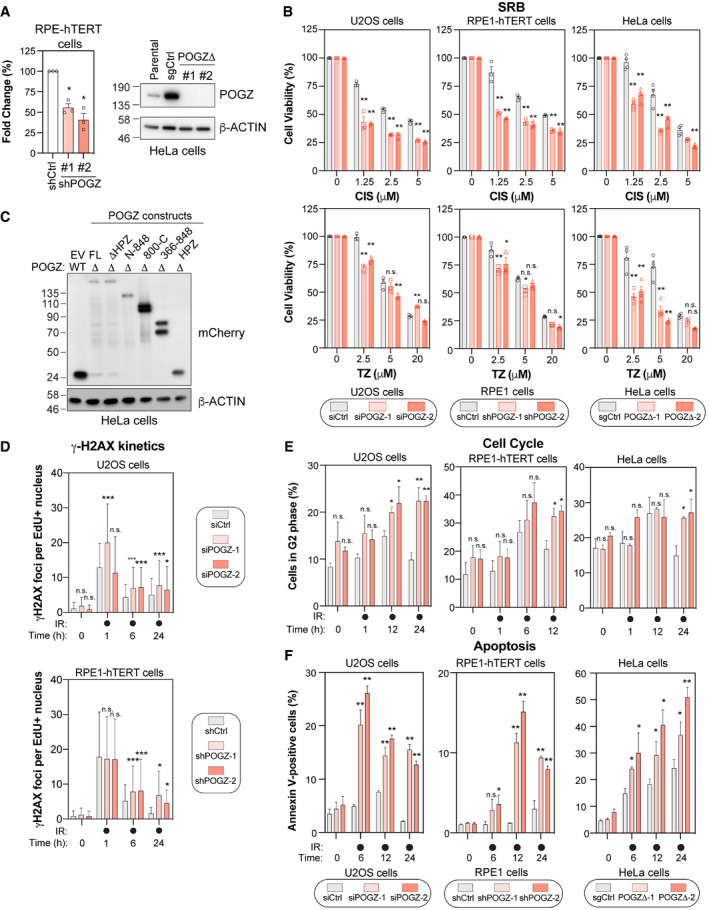
Figure EV2. Impact of altering POGZ levels on DNA repair, cell cycle progression, and apoptosis.

- RPE1‐hTERT cells (right panel) transduced with a scramble shRNA (shCtrl) or with a shRNA directed against POGZ (shPOGZ‐1 or ‐2) were processed for RNA extraction. Total RNA was isolated and cDNA was generated before POGZ RNA levels were quantified by qPCR and normalized to GAPDH RNA levels. Data are represented as a graph bar showing the mean ± SEM (n = 3 independent transductions for each condition). Significance was determined by one‐way ANOVA followed by a Dunnett’s test. *P < 0.005. HeLa sub‐clones (left panel) where POGZ was targeted by CRISPR technology (POGZΔ‐1 or ‐2) ‐or expressing a non‐targeting sgRNA control (sgCtrl), were lysed and POGZ levels were monitored by western blot. The parental HeLa cell line was added for comparison. β‐Actin was used as a loading control.
- U2OS (left panel), RPE1‐hTERT (middle panel) and HeLa cells (right panel) were monitored for their sensitivities to the intercalating agent cisplatin (CIS, top panel) and the PARPi talazopirib (TZ, bottom panel) using the SRB assay. For each cell line, the following conditions were used: U2OS cells were transfected with a non‐targeting siRNA (siCtrl) or an siRNA targeting human POGZ (siPOGZ‐1 or ‐2); RPE1‐hTERT cells were transduced a control shRNA (shCtrl) or a shRNA directed against human POGZ (shPOGZ‐1 or ‐2); HeLa cells were expressing a non‐targeting sgRNA (sgCtrl) or a sgRNA targeting human POGZ and sub‐cloned (POGZΔ‐1 or ‐2). Cells were pulsed with CIS or TZ at the indicated concentrations for 16, or 24 h, respectively, and replenished with fresh medium and incubated for 4 days. Data are represented as a bar graph showing the relative mean ± SEM, each replicate being representing as a round (Ctrl condition), square (condition #1) or triangle (condition #2) symbol (n = 3 biological replicates). Significance was determined by two‐way ANOVA followed by a Bonferroni’s test. *P < 0.05, **P < 0.0001.
- HeLa clones where POGZ was targeted by CRISPR technology (POGZΔ) or expressing a non‐targeting sgRNA control (WT), were transfected with the indicated mCherry‐tagged POGZ constructs or a mCherry empty vector (EV) and lysed 48 h post‐transfection. mCherry expression was monitored by western blot. β‐Actin was used as a loading control.
- Quantification of γH2AX foci in U2OS cells transfected with the indicated siRNA (top panel), or in RPE1‐hTERT cells stably expressing the indicated shRNA (bottom panel). Cells were treated with 1 Gy before being pulsed with Edu for 1 h and recovered at the indicated times. Data are the total number of γ‐H2AX foci in EdU+ cells and represented as a bar graph showing the mean ± SD (n = 3 biological replicates, with at least 100 cells analysed for each time point). Significance was determined by two‐way ANOVA followed by a Dunnett’s test. *P < 0.05.
- Cell cycle distribution was monitored in U2OS (left panel), RPE1‐hTERT (middle panel) and HeLa cells (right panel), transfected or transduced with the indicated condition. Cells were pulsed with BrdU for 1 h treated before being treated with 1 Gy and recovered at the indicated time points for fixation and propidium iodide staining. Data are the percentage of cells in G2 phase of the cell cycle for each indicated condition and are represented as a bar graph showing the relative mean ± SEM (n = 3 biological replicates). Significance was determined by two‐way ANOVA followed by a Dunnett’s test. *P < 0.05, **P < 0.005.
- Apoptosis was assessed by Annexin V staining in U2OS (left panel), RPE1‐hTERT (middle panel), and HeLa cells (right panel) transfected or transduced with the indicated condition, before being treated with 10 Gy and harvested at the indicated time points for flow cytometry analysis. Data are represented as a graph bar ± SEM (n = 3 biological replicates). Significance was determined by two‐way ANOVA followed by a Dunnett’s test. *P < 0.05, **P < 0.005.
Source data are available online for this figure.
