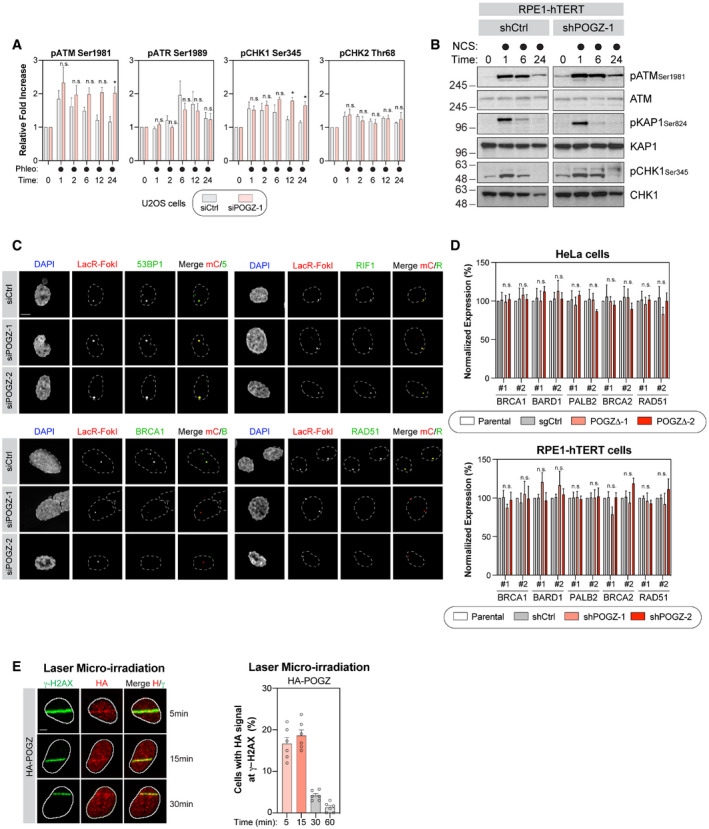
Figure EV3. POGZ and its contribution to DNA damage checkpoint signalling and cell fate.

- U2OS cells were transfected the indicated siRNA. 48 h post‐transfection, cells were pulsed with phleomycin (50 µg/ml) for 1 h before being fixed, permeabilized and subjected to flow cytometry analysis for the indicated phospho‐proteins. Data are represented as a graph bar ± SEM (n = 6 biological replicates) where the fold increase relative to untreated samples of the respective siRNA treatment is plotted. Significance was determined by two‐way ANOVA followed by a Sidak’s test. *P < 0.05.
- RPE1‐hTERT cells transduced with the indicated shRNA were pulsed with NCS (500 µg/ml) for 1 h and harvested at the indicated time points for lysate. Western blot for the indicated phospho‐ and total proteins were performed. Representative images are displayed in this panel.
- Representative images from the U2OS‐FokI data summarized in Fig 3A. U2OS‐LacR‐FokI cells were transfected with the indicated siRNA. The following day, DSB induction was performed with 4‐OHT and Shield‐1. Cells were processed for immunofluorescence microscopy using primary antibodies directed against 53BP1, RIF1, BRCA1 and RAD51. Scale bar = 2.5 µm.
- RNA was extracted from HeLa cells where POGZ was targeted by CRISPR technology (left panel) or from RPE1‐hTERT cells transduced with the indicated shRNA (right panel). cDNA was produced and RNA levels of the indicated HR factors were monitored by qPCR and normalized to GAPDH RNA levels. Data are represented as a graph bar ± SEM (n = 3 biological replicates).
- U2OS cells stably expressing a HA‐tagged version of POGZ were pre‐sensitized with 10 μg/ml Hoescht 33342 before being exposed to UV micro‐irradiation. Immunofluorescence against HA epitope and endogenous γ‐H2AX was subsequently performed to monitor POGZ accumulation at sites of DNA damage. Shown are representative micrographs of cells displaying for HA and γ‐H2AX staining (left, scale bar = 5 μm) and quantification of U2OS cells expressing HA‐POGZ (right). Data are represented as a graph bar ± SEM (n = 6 biological replicates) where the percentage of cells with HA‐POGZ signal co‐localizing with γ‐H2AX at the indicated time points is plotted.
Source data are available online for this figure.
