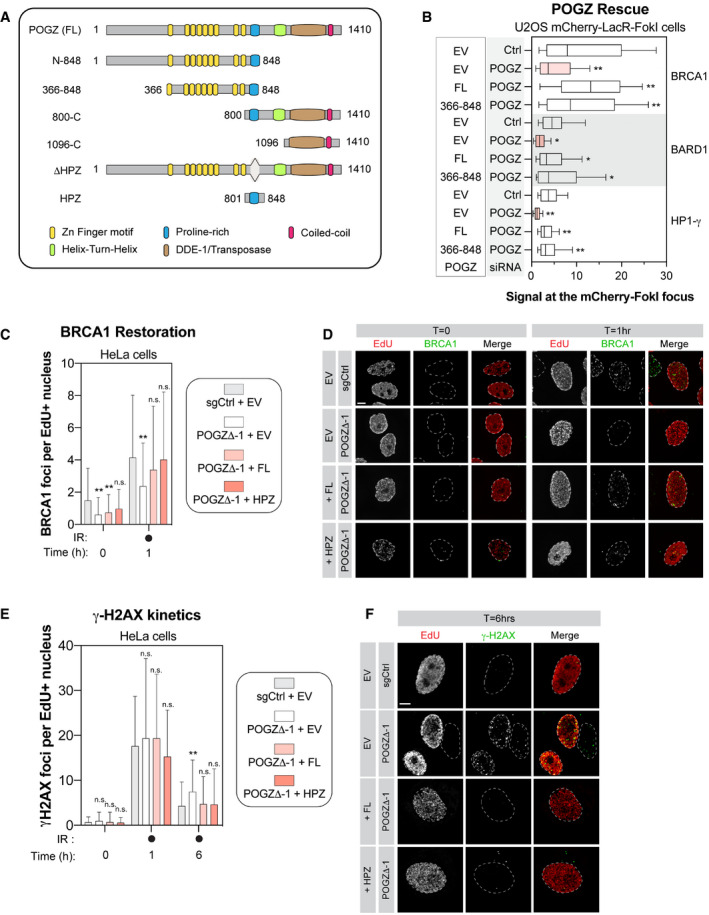
Schematic diagram outlining the different domains of human POGZ and the different deletion constructs of POGZ that we generated and analysed.
U2OS stably expressing mCherry‐LacR‐FokI were transduced with the indicated siRNA. Twenty‐four hours post‐transfection, cells were transfected with an empty Flag vector (EV) or a siRNA‐resistant FLAG‐tagged POGZ cDNA construct corresponding to indicated rescue mutant (full‐length, FL; POGZ366–848, 366–848). Twenty‐four hours after plasmid transfection, DNA damage was induced using Shield‐1 and 4‐OHT. Immunofluorescence against the indicated protein was subsequently performed to monitor its respective accumulation at sites of DNA damage by confocal microscopy. Data are represented as a box‐and‐whisker (10–90 percentile) where the fluorescent signal at the mCherry focus was normalized to nuclear background. At least 100 cells per condition were counted. Significance was determined by two‐way ANOVA followed by a Dunnett’s test. *P < 0.005, **P < 0.0001.
HeLa cells transfected with the indicated construct were monitored for their capacity to form IR‐induced BRCA1 foci. HeLa cells where POGZ has been targeted by CRISPR technology (POGZΔ‐1) and in control HeLa cells (sgCtrl) were transfected by an empty Flag vector (EV) or a sgRNA‐resistant FLAG‐tagged POGZ cDNA construct corresponding to indicated rescue mutant (full‐length, FL; POGZ801–848, HPZ). Cells were exposed to 1 Gy before being pulsed with Edu for 1 h and were recovered 1 h post‐exposure to IR. Cells were fixed, stained and imaged via confocal microscopy. Data are the total number of BRCA1 foci in EdU+ cells and represented as a bar graph showing the mean ± SD (n = 3 biological replicates, with at least 100 cells analysed for each time point). Significance was determined by two‐way ANOVA followed by a Dunnett’s test. *P < 0.05, **P < 0.0001.
Representative images used for quantification in (C). Scale bar = 5 µm.
Similar as in (C) except that γ‐H2AX foci were monitored at the indicated time points by confocal microscopy. Data are the total number of γ‐H2AX foci in EdU+ cells and represented as a bar graph showing the mean ± SD (n = 3 biological replicates, with at least 100 cells analysed for each time point). Significance was determined by two‐way ANOVA followed by a Dunnett’s test. *P < 0.05.
Representative images used for quantification in (E). Scale bar = 5 µm.

