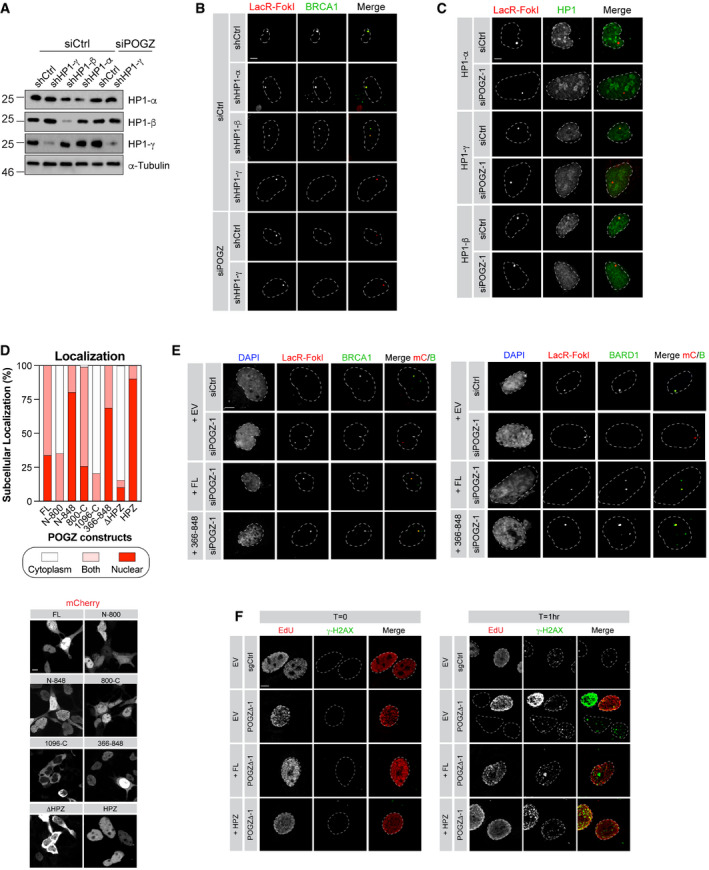
Figure EV4. Interaction of POGZ and HP1 isoforms is necessary for nuclear localization and sufficient to restore DNA repair in POGZ‐depleted cells.

- U2OS‐FokI cells stably expressing the indicated shRNA and transfected with the indicated siRNA were analysed by western blot. 48 h post‐transfection, cells were harvested for lysate and probed for the indicated HP1 isoforms. α‐Tubulin was used as a loading control.
- Representative images of BRCA1 accumulation in U2OS‐mCherry‐LacR‐FokI cells transduced with the indicated shRNA and transfected with the indicated siRNA. Quantification of the BRCA1 signal at the mCherry dot is represented in Fig 3E. Scale bar = 5 μm.
- Representative images of the different HP1 isoforms accumulating at FokI‐induced DSB in U2OS‐mCherry‐LacR‐FokI cells transfected with the indicated siRNA. Quantification of the HP1 signal at the mCherry dot is represented in Fig 3G. Scale bar = 5 μm.
- HEK293T cells were transfected with mCherry‐tagged truncation constructs of POGZ or full‐length mCherry‐POGZ (FL). Cells were harvested 24 h post‐transfection and re‐plated on to coverslips. 48 h post‐transfection, cells were fixed, permeabilized and stained with DAPI. Cells were subsequently visualized by confocal microscopy and quantified for the presence of mCherry signal in the nucleus, the cytoplasm or both, per field of view. A minimum of five fields of view were sampled per biological replicate (n = 3 biological replicates). Data are represented as a bar graph (top) where the proportion of each sub‐cellular localization is represented for each indicated construct. Representative images are shown in bottom panel (scale bar = 5 μm).
- U2OS‐mCherry‐LacR‐FokI cells were transfected with the indicated siRNA. Twenty‐four hours post‐transfection, cells were transfected with a Flag empty vector (EV) or a siRNA‐resistant Flag‐tagged POGZ construct corresponding to indicated rescue mutant. DNA damage was induced, 24 h post‐transfection, with Shield1 and 4‐OHT. Cells were stained for BRCA1 (left panel) or BARD1 (right panel) and imaged via confocal microscopy. Representative images of the data quantified in Fig 4B. Scale bar = 5 μm.
- HeLa cells where POGZ has been targeted by CRISPR (POGZΔ‐1) or a control sgRNA (sgCtrl) were transfected with a mCherry empty vector (EV) or a mCherry‐tagged POGZ construct corresponding to indicated rescue mutant. Cells were treated with 1 Gy and were recovered at the 1 h post‐IR exposure. Cells were fixed, stained for γ‐H2AX, and imaged via confocal microscopy. Representative images of the data quantified in Fig 4E. Scale bar = 5 μm.
Source data are available online for this figure.
