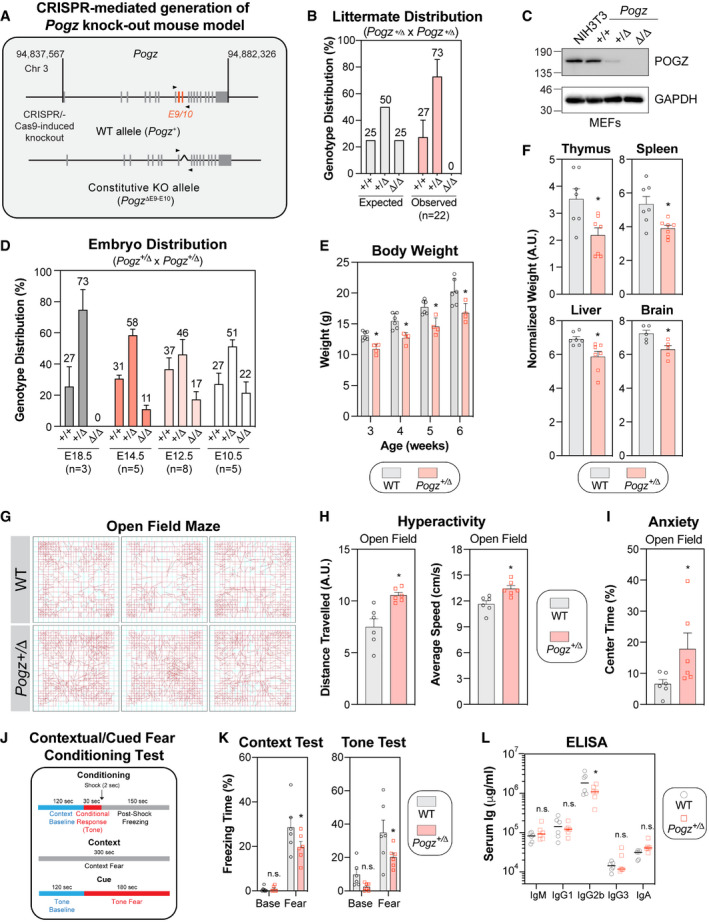
Figure 5. Pogz haplo‐insufficiency in mice recapitulates the clinical features observed in patients affected by the WHSUS.

- Schematic diagram outlining the generation of CRISPR/Cas9‐mediated Pogz +/Δ mouse model. A region spanning critical exons 9 and 10 of the murine Pogz gene on chromosome 3 was deleted using dual sgRNA CRISPR.
- Expected and observed genotypic distribution of offspring of heterozygous Pogz +/Δ crosses. Genotype was determined by PCR at time of weaning (3 weeks). Data are represented as a bar graph showing the mean ± SEM (n = 22 individual litters, across 5 different breeding pairs).
- Observed genotypic distribution of offspring of heterozygous Pogz +/Δ crosses at specified embryonic day. Each litter is considered a biological replicate. Data are represented as a bar graph showing the mean ± SEM (n for each embryonic day is specified).
- Expression analysis of Pogz by western blot in mouse embryonic fibroblasts (MEFs) generated from E12.5 embryos with the indicated genotype. NIH3T3 cells were used as a comparison. Gadph was used a loading control.
- The body mass of male wild‐type (WT) or Pogz +/Δ mice was monitored weekly for 4 weeks post‐weaning. Data are represented as a bar graph showing the mean ± SEM and each mouse is represented by a round dot (WT) or a square (Pogz +/Δ). At least 4 mice per genotype was monitored. Significance was determined by two‐way ANOVA followed by a Sidak’s test. *P < 0.05.
- The indicated organ mass of male wild‐type (WT) or Pogz +/Δ mice was calculated relative to total body mass. Data are represented as a bar graph showing the mean ± SEM and each mouse is represented by a round dot (WT) or a square (Pogz +/Δ) (n = 7 6 mice per genotype). Significance was determined by unpaired two‐tailed t‐test. *P < 0.05.
- Representative movement traces of the indicated mice used for quantification in (H) and (I).
- Quantification of the distance travelled (left panel) and the average speed (right panel) of each mouse (n = 6 mice per genotype) in the open field. Data are represented as a bar graph showing the mean ± SEM and each mouse is represented by a a round dot (WT) or a square (Pogz +/Δ). Significance was determined by unpaired two‐tailed t‐test. *P < 0.005.
- The percentage of time that each mouse spent in the middle of the open field was quantified and represented as the mean ± SEM, each mouse being represented by a round dot (WT) or a square (Pogz +/Δ) (n = 6 mice per genotype). Significance was determined by unpaired two‐tailed t‐test. *P < 0.005.
- Schematic diagram outlining the conditioning/experimental set up quantified in (K) of the contextual fear tests.
- The percentage of freezing time in the different experimental conditions (context test, left panel; cue (tone) test, right panel) was monitored for each mouse and is represented as the mean ± SEM, each mouse being represented by a round dot (WT) or a square (Pogz +/Δ) (n = 6 mice per genotype). Significance was determined by two‐way ANOVA followed by a Sidak’s test. *P < 0.05.
- Plasma was isolated from cardiac punctures of wild‐type (WT) or Pogz +/Δ mice (8 weeks) and assessed for circulating levels of specified immunoglobulin isotypes. Each mouse is represented by a round dot (WT) or a square (Pogz +/Δ) (n = 6 mice per genotype). Significance was determined by two‐way ANOVA followed by a Bonferroni’s test. *P < 0.005.
Source data are available online for this figure.
