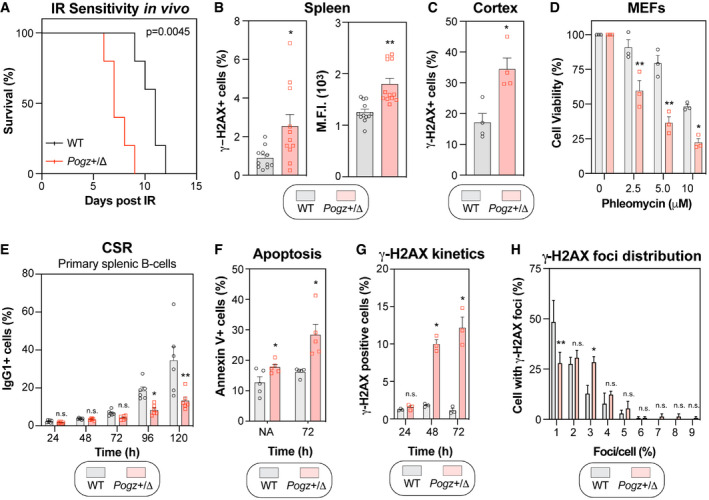
Wild‐type (WT) and Pogz
+/Δ mice were subjected to a lethal dose of ionizing radiation (8.5 Gy) before recovering in sterile conditions and being assessed for their sensitivity to IR. Data are represented as a Kaplan–Meier survival curve of each genotype (n = 6 mice per genotype). Significance was determined by log‐rank (Mantel‐Cox) test. *P < 0.005.
Quantification of phosphorylated‐H2AX (γ‐H2AX) levels by flow cytometry. Splenocytes isolated from 8‐week‐old wild‐type (WT) and Pogz
+/Δ mice were processed for γ‐H2AX staining and data are represented as bar graph showing the mean percentage of cells that were γ‐H2AX‐positive ± SEM (left panel) or the mean fluorescence intensity (M.F.I.) of the γ‐H2AX signal ± SEM (right panel), each mouse being represented by a round dot (WT) or a square (Pogz
+/Δ) (n = 11 mice for each genotype). Significance was determined by unpaired two‐tailed t‐test. *P < 0.05, **P < 0.0005.
Brain slices were sectioned from 6‐week‐old wild‐type (WT) and Pogz
+/Δ mice, followed by immunostaining for phosphorylated H2AX (γ‐H2AX). Data are the percentage of cells with γ‐H2AX signal present in the nucleus per field of view and are represented as a bar graph showing the mean ± SEM, each mouse being represented by a round dot (WT) or a square (Pogz
+/Δ) (n = 4 for each genotype with three distinct fields quantified for each mouse).
MEFs were monitored for their sensitivity to the radiomimetic drug phleomycin using the SRB assay. Immortalized MEFS obtained from the indicated genotype were treated with increasing concentrations of phleomycin for 1 h, replenished with fresh medium and incubated for 4 days before being processed for SRB assays. Data are represented as a bar graph showing the relative mean ± SEM, each replicate being representing as a round dot (WT) or a square (Pogz
+/Δ) Significance was determined by two‐way ANOVA followed by a Bonferroni’s test. *P < 0.005, **P < 0.0005.
CD43‐negative primary splenocytes from 8‐week‐old wild‐type (WT) and Pogz
+/Δ mice were stimulated ex vivo with IL‐4 (50 ng/ml) and LPS (25 µg/ml). Cells were harvested at the indicated time points and assessed for their surface expression of IgG1 by flow cytometry. Data are represented as a bar graph showing the mean ± SEM, each mouse being represented by a round dot (WT) or a square (Pogz
+/Δ) (n = 6 mice per genotype). Significance was determined by two‐way ANOVA followed by a Bonferroni’s test. *P < 0.05, **P < 0.0001.
Similar as in (E), except those cells were monitored for apoptosis by Annexin V staining. Data are represented as a bar graph showing the mean ± SEM, each mouse being represented by a round dot (WT) or a square (Pogz
+/Δ) (n = 5 mice per genotype). Significance was determined by two‐way ANOVA followed by a Bonferroni’s test. *P < 0.05.
Similar as in (E), except that cells were monitored for phosphorylated H2AX (γ‐H2AX) levels by flow cytometry at the indicate time points post‐stimulation with IL‐4/LPS. Data are represented as a bar graph showing the mean ± SEM, each mouse being represented by a round dot (WT) or square (Pogz
+/Δ) (n = 3 mice per genotype). Significance was determined by two‐way ANOVA followed by a Bonferroni’s test. *P < 0.05.
Stimulated CD43‐negative splenocytes were loaded on slides via Cytospin and processed for γ‐H2AX immunofluorescence. Cells were fixed, stained and imaged via confocal microscopy. Data are the percentage of cells in a field of view with indicated γ‐H2AX foci and are represented as a bar graph showing the mean ± SEM. At least 100 cells per genotype were counted. Significance was determined by two‐way ANOVA followed by a Sidak’s test. *P < 0.05, **P < 0.005.

