
Figure 1. G3BP1 engages cGAS in a condensed state.
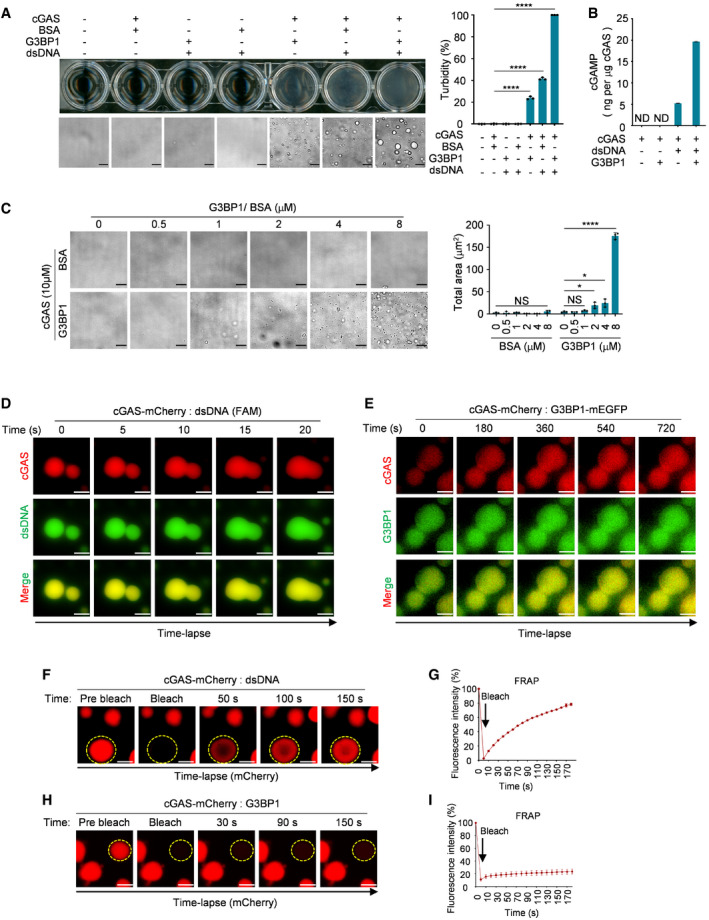
- Turbidity and bright‐field microscope images of indicated groups (left) and the quantitative analysis of turbidity of samples were measured by absorbance at 600 nm (right). 10 μM cGAS, 5 μM G3BP1, 5 μM BSA and 100 nM dsDNA (60 bp) were used in these assays. n = 3 biological replicates.
- cGAMP production assays. Recombinant cGAS (10 μM) and G3BP1 (10 μM) were incubated with 100 nM dsDNA. The produced cGAMP was quantitatively analyzed by liquid chromatography–mass spectrometry/multiple reaction monitoring (LC‐MS/MRM). ND, not detected. n = 3 technical replicates.
- Bright‐field microscope images of cGAS (10 μM) with indicated concentrations of BSA or G3BP1 (left) and a quantitative analysis of the total area of condensates (right). n = 3 biological replicates.
- Time‐lapse imaging of liquid droplets fusion after mixing 10 μM cGAS‐mCherry with 1 μM FAM‐labeled dsDNA.
- Time‐lapse imaging of liquid droplets fusion after mixing 40 μM cGAS‐mCherry with 10 μM G3BP1‐mEGFP.
- FRAP analysis of DNA‐induced droplets of cGAS (1 μM dsDNA, 10 μM cGAS‐mCherry), the yellow dotted circle indicated the region of photobleaching.
- FRAP curve of (F). n = 3 biological replicates.
- FRAP analysis of cGAS‐G3BP1 droplets. 10 μM cGAS‐mCherry and 5 μM G3BP1 were used. The yellow dotted circle indicated the region of photobleaching.
- FRAP curve of (H). n = 3 biological replicates.
Data information: Representative images are shown (A, C–F and H). Error bars, mean with s.d. (A–C, G and I), *P < 0.05, ****P < 0.0001, two‐tailed t‐test. NS, non‐significant; FRAP, fluorescence recovery after photobleaching. Scale bars, 10 μm (A and C), 5 μm (D), 3 μm (E), 2 μm (F and H). See also Fig EV1.