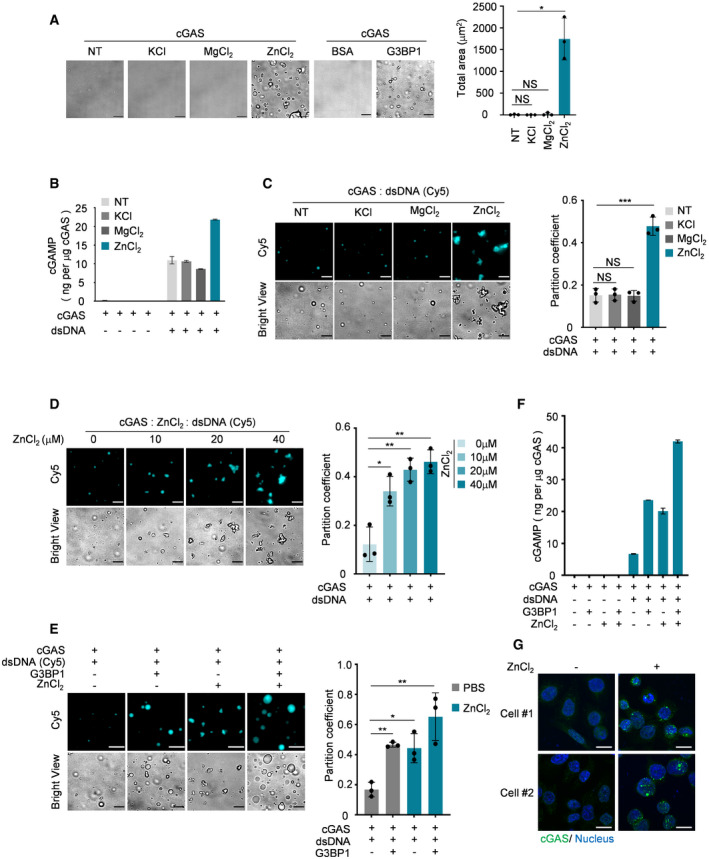
Figure 6. Zn2+ promotes condensation and the DNA‐induced LLPS of cGAS.

-
ABright‐field microscope images of indicated groups (left) and a quantitative analysis of total area of droplets (right). n = 3 biological replicates. 10 μM cGAS, 5 μM G3BP1 and 50 μM KCl, 50 μM MgCl2, 50 μM ZnCl2 were used.
-
BcGAMP production assays. Recombinant cGAS (10 μM) and indicated ions (100 μM) were incubated with or without dsDNA (100 nM). The production of cGAMP was analyzed by LC‐MS/MRM. n = 3 technical replicates.
-
CFluorescent images and analysis of DNA‐induced cGAS LLPS in the presence of the indicated reagent. n = 3 biological replicates. 10 μM cGAS, 50 μM of each ion and 100 nM dsDNA were used in these assays.
-
DFluorescent images and analysis of DNA‐induced LLPS of cGAS in the presence of different amounts of ZnCl2. n = 3 biological replicates. 10 μM cGAS and 100 nM dsDNA were used in the assay.
-
EFluorescent images and analysis of DNA‐induced LLPS of cGAS in the presence of G3BP1 (2 μM) and/or ZnCl2 (20 μM) as indicated. n = 3 biological replicates.
-
FcGAMP production assays. Recombinant cGAS (10 μM), G3BP1(10 μM) and ZnCl2 (100 μM) were incubated with or without dsDNA (100 nM) as indicated. The produced cGAMP was quantitatively analyzed by LC‐MS/MRM. n = 3 technical replicates.
-
GImmunofluorescence staining of cGAS in HeLa cells stimulated with ZnCl2 (100 μM). The images were acquired by ZEISS LSM 880 Confocal Microscopy.
Data information: Representative images are shown (A, C–E and G). Scale bars, 10 μm. The partition coefficient was calculated as the total fluorescence intensity of droplets/bulk fluorescence intensity of background (C–E). Hoechst (blue), nuclear staining. Error bars, mean with s.d. (A‐F), *P < 0.05, **P < 0.01, ***P < 0.001, two‐tailed t‐test. NS, non‐significant; NT, non‐treated.
