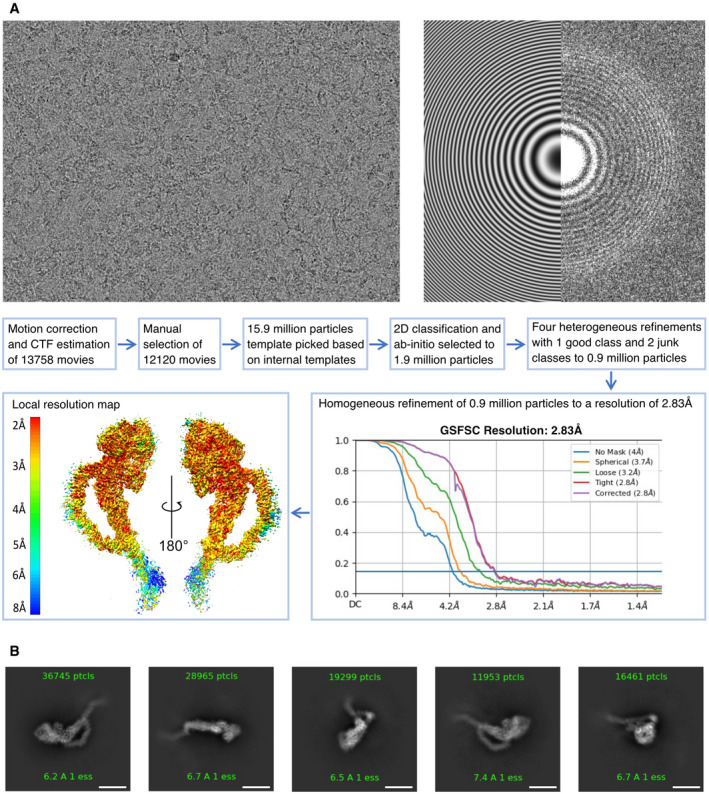
Figure EV1. Road map for obtaining a 2.8 Å resolution cryo‐EM map of TcdA.

- Workflow from cryoSPARC processing. Top images show examples of raw micrograph (left) and corresponding contrast transfer function (CTF) fit in Fourier space (right) with theoretical fit shown on the left side and experimental data on the right side. In total, 13,758 movies were processed using patch motion correction and CTF estimation including data curation based on defocus, CTF fit, and motion correction values. The particles were picked using a template based on initial 2D classes from a subset of the data. Good particles were selected using 2D classification and ab initio refinements followed by multiple heterogeneous refinement runs and resulted in 0.9 million good particles. A final homogeneous refinement run yielded a map at 2.8 Å resolution based on an FSC threshold of 0.143 (graph bottom right). The resulting map (bottom left) is colored according to local resolution (contoured at 6.7 σ).
- Representative 2D classes of TcdA particles showing side, back, and top views. The region extending from residue 2,383 of the CROPs domain of TcdA is visible in the 2D classes but averaged out in the final 3D map because of high flexibility in this region. Scale bars, 100 Å.
