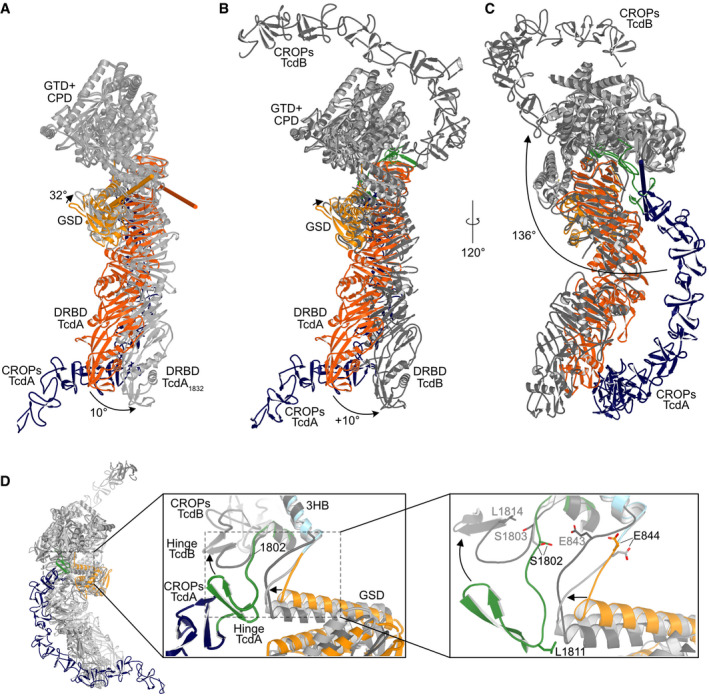
Figure 2. Comparison of the cryo‐EM structure of TcdA (pH 7.5) to the crystal structure of TcdA1832 (pH 6.0) and full‐length TcdB (pH 5.2).

- Superposition of TcdA and TcdA1832. The GTD and CPD of TcdA are superimposed on the corresponding domains of TcdA1832 (all in light gray). The remaining domains of TcdA are colored as in Fig 1. In the TcdA1832 structure, the DRBD (light gray) swings away from the CROPs domain present in TcdA with a ~10° motion around the screw axis described by the orange rod, while the GSD of TcdA1832 tilts ~32° in the opposite direction around the axis illustrated by the yellow rod.
- Superposition of TcdA and TcdB. The GTD and CPD of TcdA are superimposed on the corresponding domains of TcdB (all in dark gray). The remaining domains of TcdA are colored as in Fig 1. The DRBD and GSD of TcdB move in a fashion similar to the corresponding domains of TcdA1832.
- The same superposition of TcdA and TcdB as in B but rotated to illustrate the ~136° rotation of the CROPs domain around the screw axis illustrated by the dark blue rod.
- Close‐up view of the hinge region in a superposition of TcdA (colored as in Fig 1), TcdA1832 (light gray), and TcdB (dark gray). Residues in TcdB are written in gray and in black for TcdA/TcdA1832.
