
Figure EV2. Comparison of TcdA and TcdB structures.
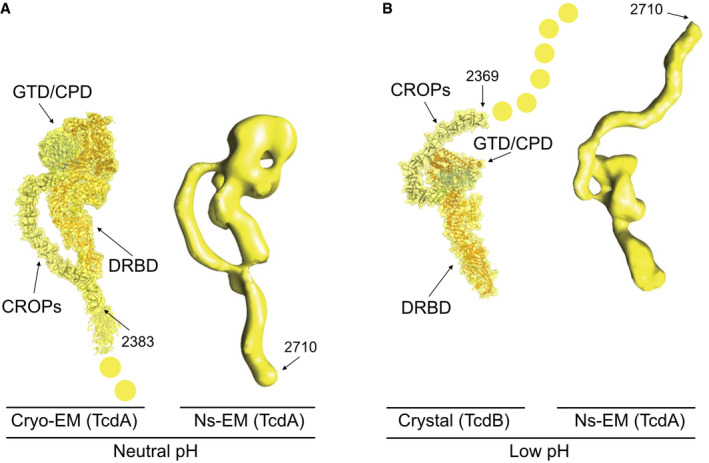
- Comparison of TcdA and TcdB structures to negative staining EM (Ns‐EM) of TcdA. The 2.8 Å cryo‐EM map with structure of TcdA modeled into the map next to a negative stain EM map of TcdA at neutral pH (Pruitt et al, 2010). Yellow dots extending from the cryo‐EM map represent the C‐terminal part of the CROPs which is averaged out in the final 3D map.
- Crystal structure of TcdB at pH 5.2 with a reoriented CROPs domain (Chen et al, 2019) compared to a negative stain EM map of TcdA at pH 4.5 (Pruitt et al, 2010). Yellow dots represent the C‐terminal part of the CROPs domain, which is present in TcdA but not in TcdB. Negative stain EM images from Pruitt et al, 2010, are used with permission from PNAS.