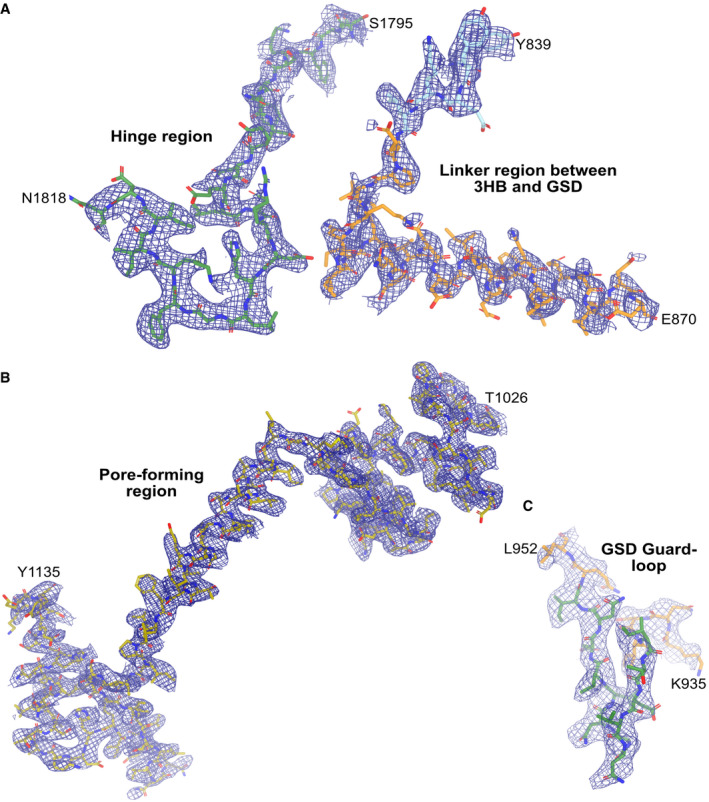
Figure EV3. The 2.8 Å cryo‐EM map presented in different regions of the TcdA structure.

- Map of the hinge region (residues 1,795–1,818) as well as the linker region between the 3HB and the GSD (residues 839–870).
- Map of the entire pore‐forming region from residues 1,026–1,135.
- Map of the guard loop in GSD from residues 936–952. All maps are contoured at 8 σ.
