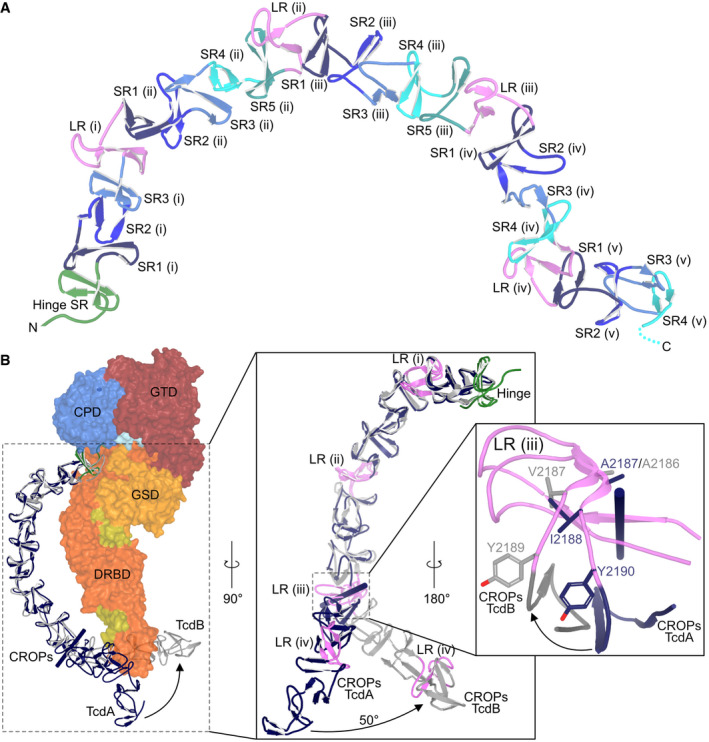
Figure 5. The CROPs domain.

- Structure of the CROPs domain of TcdA. As shown for TcdB (Chen et al, 2019), the link between the DRBD and the CROPs domain is separated by the hinge region, which contains its own SR (green). This is followed by a series of SRs (blue/green colors) that are separated by LRs (pink). The CROPs domain was modeled until residue 2,383 in the SR4 (unit v).
- Structural comparison of the CROPs domains of TcdA (blue) and TcdB (gray). The CROPs domain of TcdB (residues 1,802–2,368) is superimposed onto the partial CROPs domain of TcdA (residues 1,833–2,383). The two domains superimpose with a Cα r.m.s.d. of 1.71 Å (Table 1) from residue 1,810 in the hinge region to residue 2,187 in LR (iii) of TcdA. Beyond that, the two domains follow different paths where CROPs domain of TcdB rotates ~50° relative to that of TcdA.
