
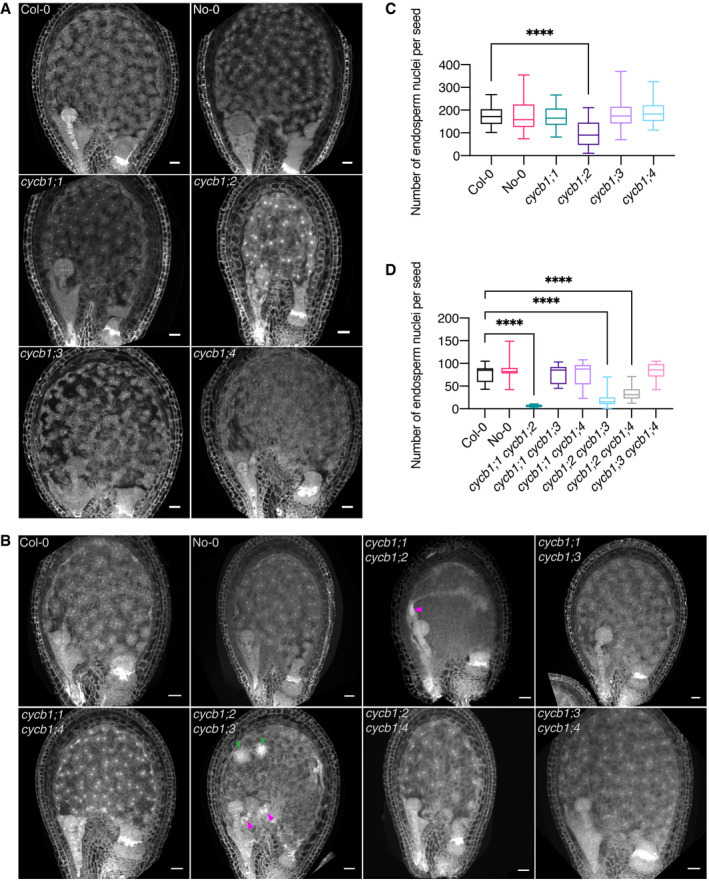
Figure 2. CYCB1 mutations delay endosperm proliferation.
-
A, BConfocal microscopy images of seeds 3 DAP. Endosperm and embryo morphology in cycb1 single (A) and double (B) mutants. Magenta arrowheads indicate enlarged endosperm nuclei, while green arrowheads indicate atypical agglomerates of endosperm nuclei. Scale bars: 25 μm.
-
C, DQuantification of endosperm nuclei in cycb1 single (C) and double (D) mutants. Boxes and whiskers represent min to max values with the median indicated as a central horizontal line, n = 26–30 seeds per genotype. Asterisks show significant differences in the number of endosperm nuclei per seed in a Kruskal–Wallis test followed by Dunn’s multiple comparisons test (****P < 0.0001).