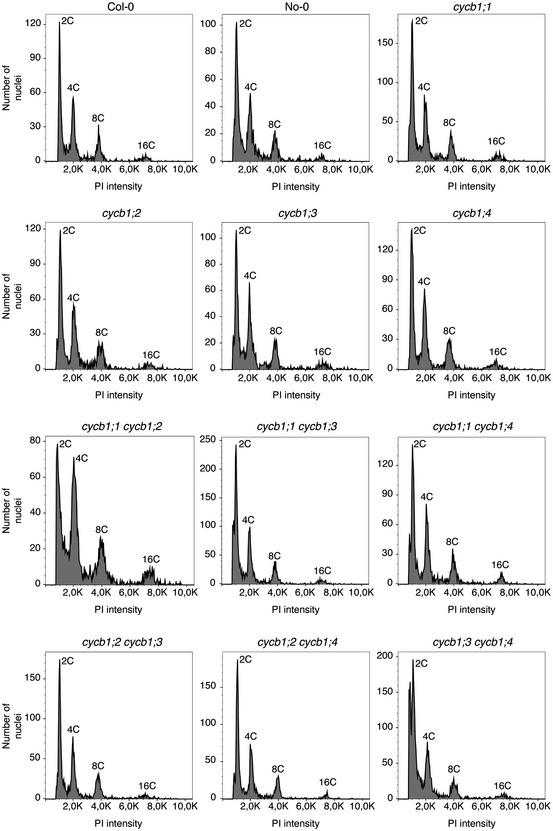
Figure EV5. Ploidy analysis of young seedlings of the single and double mutants.

Flow cytometrical quantification of the different nuclear ploidies, as indicated by propidium iodide (PI) intensity. Single (top rows) and double (bottom rows) mutants have been analyzed. The individual genotypes are indicated on the top of each graph. Each peak has been labeled according to the expected nuclear content (2C, 4C, 8C or 16C).
