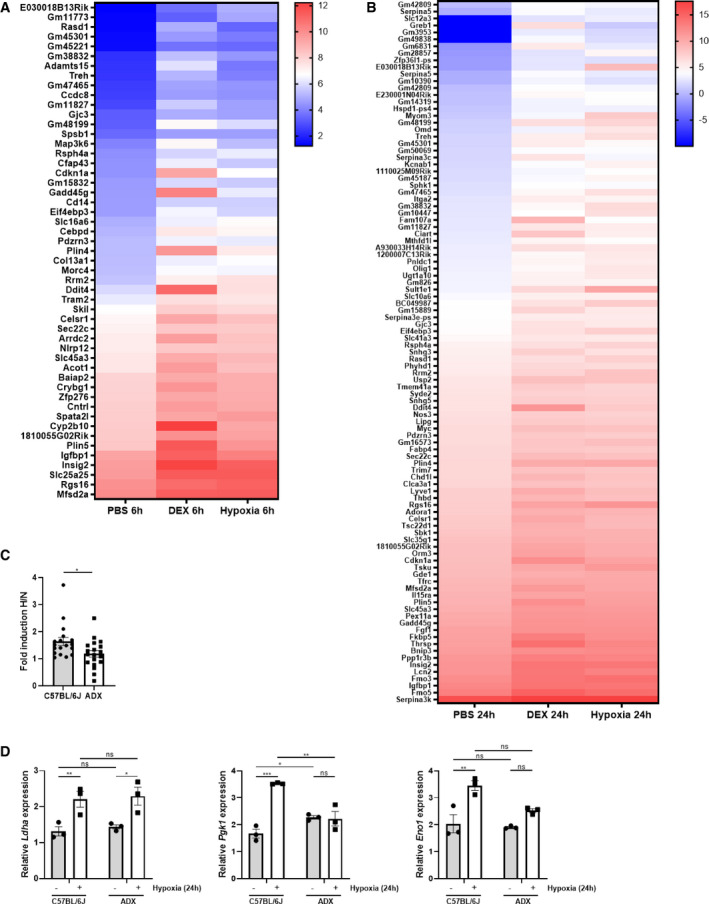
Figure EV2. Hypoxia itself causes the induction of GR‐responsive genes.

-
A, BFemale C57BL/6J mice were put in normoxia or hypoxia for 6 h (A) or 24 h (B), injected with PBS or DEX (10 mg/kg) and 2 h later, liver was isolated for analyses. N = 3 per group for a single RNA‐seq. (A) Heatmap representing stress GRE genes induced by hypoxia (6 h) and DEX in normoxia. Log2 values are shown of the counts of the stress GRE genes based on the RNA‐seq data (LFC > 1 and P ≤ 0.05). (B) Heatmap representing stress GRE genes induced by hypoxia (24 h) and DEX in normoxia. Log2 values are shown of the counts of the stress GRE genes based on the RNA‐seq data (LFC > 1 and P ≤ 0.05).
-
C, DFemales C57BL/6J and ADX mice were put in normoxia (N) and hypoxia (H, 6 and 24 h) and the expression of HIF target genes were evaluated in the liver via RT–qPCR. (C) Fold inductions (H/N) of HIF target genes in C57BL/6J and ADX mice. P‐value was calculated using a two‐way unpaired Student’s t‐test. (D) Examples of the expression levels of HIF target genes. N = 3 per group.
Data information: All bars represent mean ± SEM. P‐values were calculated using two‐way ANOVA followed by post‐hoc Šídák’s multiple comparisons test to correct for multiple testing during the pairwise multiple comparisons, except if otherwise stated. ***P < 0.001, **P < 0.01, *P ≤ 0.05.
