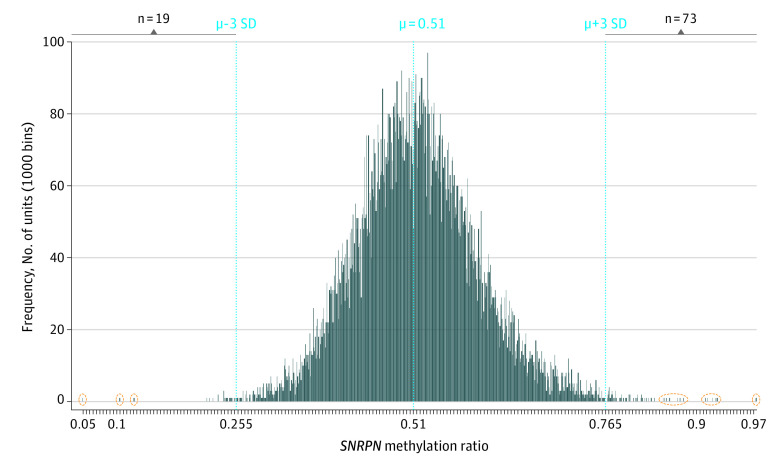
Figure 2. Quantitative Analysis of SNRPN Promoter Methylation Using MS-QMA First-Tier Testing on Newborn Blood Spots (NBS) From 16 579 Infants.
Frequency distribution histogram from 16 579 NBS samples, with each vertical bar representing NBS methylation values. While the mean (μ), minimum, and maximum values (2 SDs from the mean) in this larger data set were almost identical to those in the initial validation data set (Figure 1), the spread of tails at both ends of the distribution for this larger data set was greater. Subsequently, the minimum and maximum cut-off values of the normal distribution for the larger data set were increased to 3 SDs from the mean for calling of positive cases. Vertical broken lines represent the mean methylation value and +/− 3 SDs from the mean; the n values indicate the number of positive cases above or below these upper and lower normal distribution values; and extreme outliers at either end of the distribution reflexed for second-tier testing are circled in orange.

