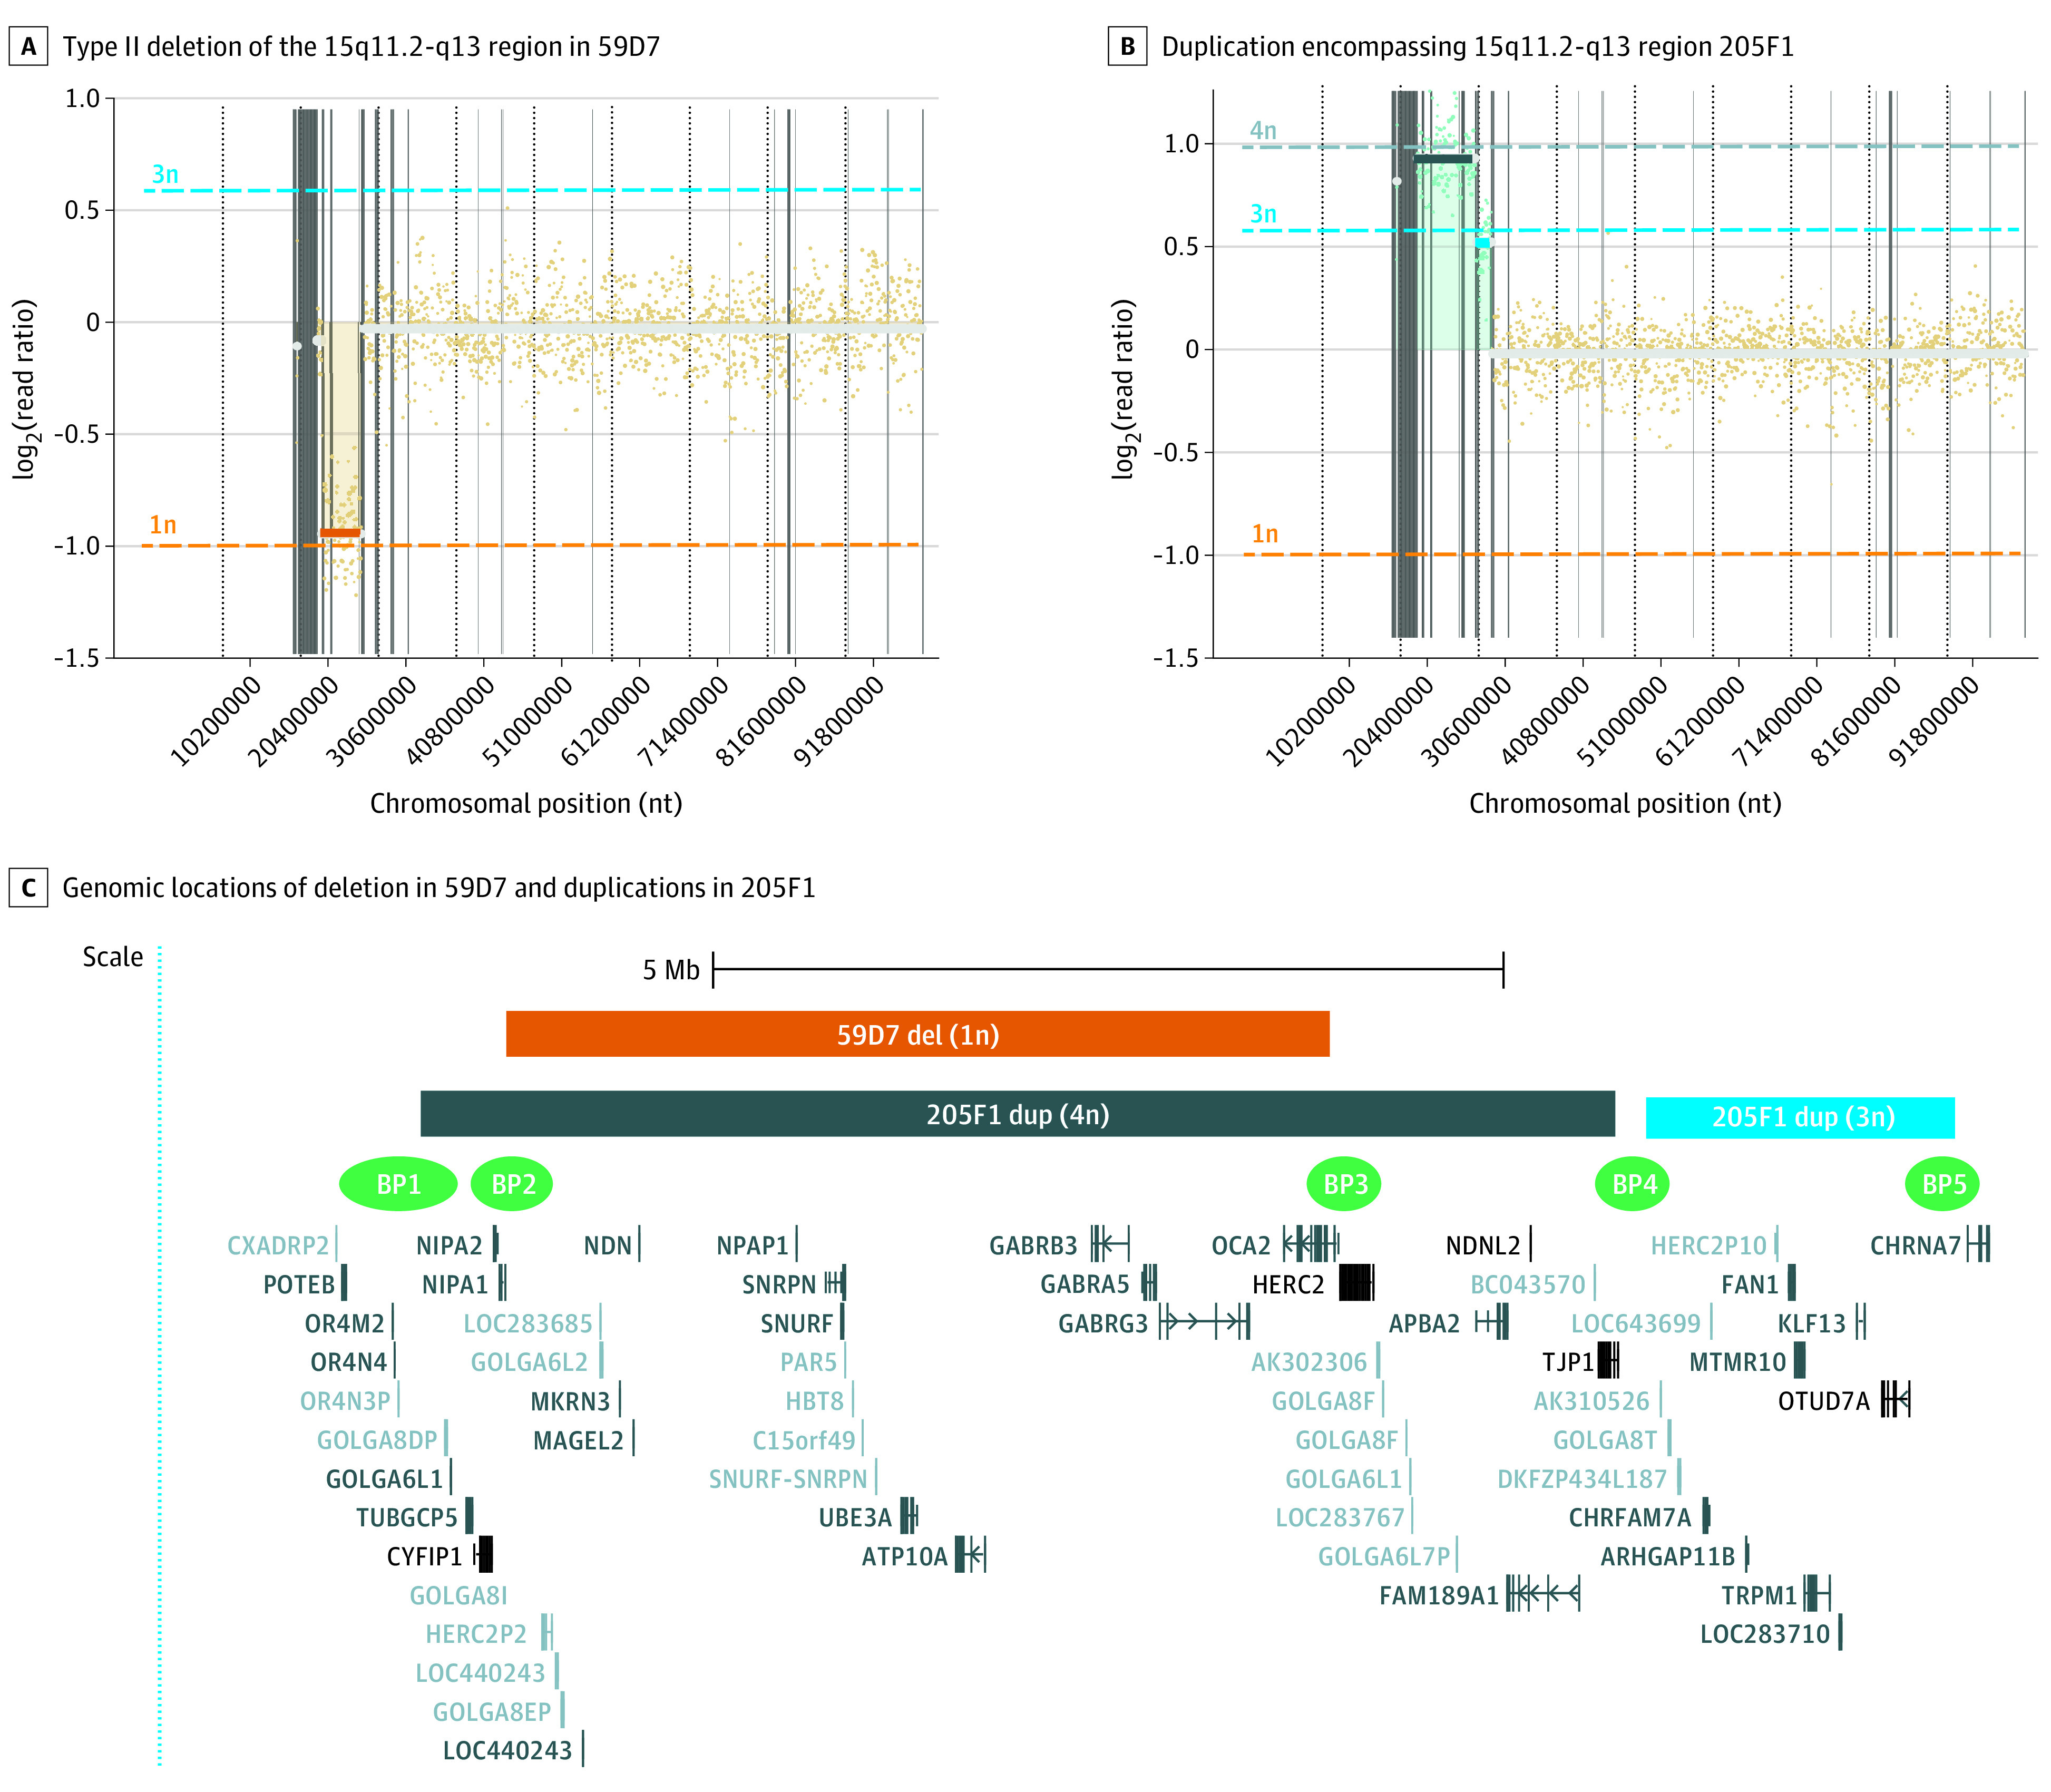
Figure 5. Confirmatory Testing Using Low-Coverage Whole Genome Sequencing (LC-WGS).

LC-WGS analysis on newborn blood spot (NBS) samples that tested positive by first- and second-line testing, with the lowest and highest copy number variation results of the shortlisted samples, confirming that A, 59D7 is a typical Angelman syndrome case caused by the type II deletion of the 15q11.2-q13 region between BP2 and 3 highlighted by orange rectangle; and that B, 205F1 is an idic15 case, with larger duplicated region encompassing 15q11.2-q13 PWS/AS imprinted center highlighted by the dark blue rectangle; the proximal region is highlighted by light blue rectangle, encompassing an additional gene cluster proximal to CHRNA7, with specific locations and gene names included in panel C. Approximate locations of common breakpoints BP1 to BP5 are indicated in green.18,19 In panels A and B, the gray, light blue, and orange lines represent the thresholds for the relative numbers of 4 copies, 3 copies, and 1 copy, respectively. The gray line with the log2(ratio) of 0 (y-axis) represents the threshold for the relative number of 2 copies. BP indicates breakpoint.
