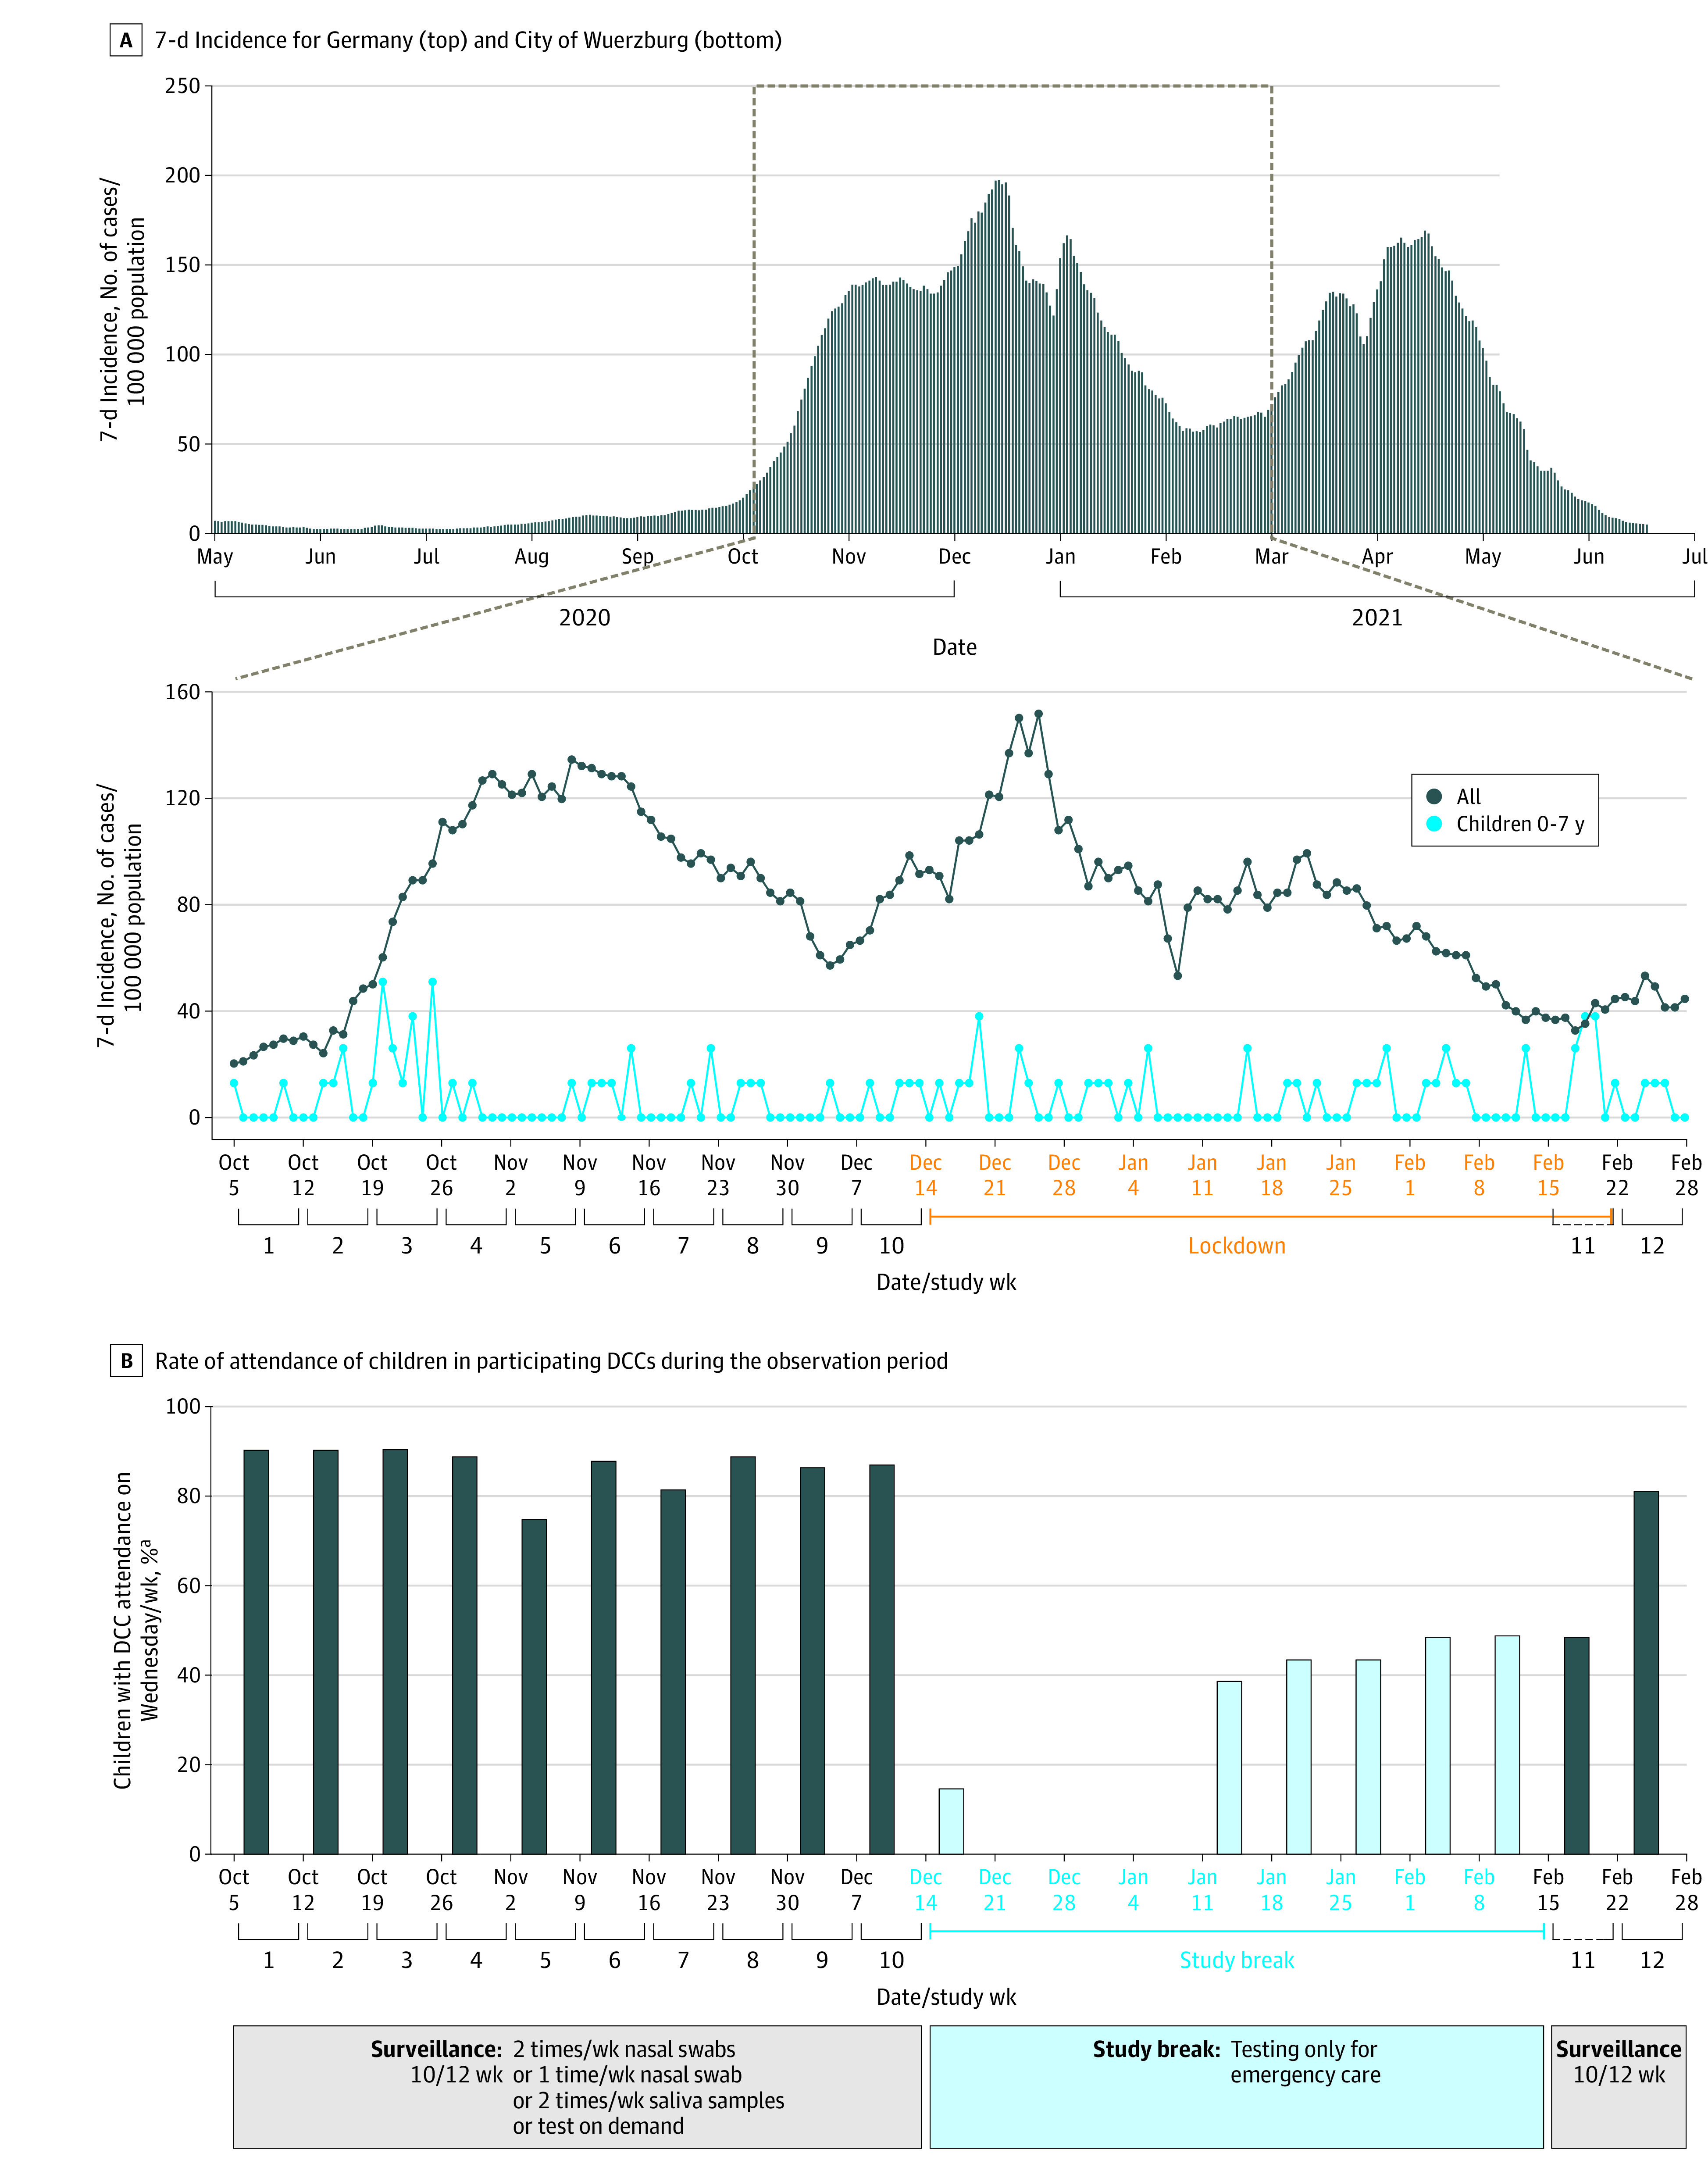
Figure 2. General Overview of the Pandemic Activity in Wuerzburg During the Study Period.

A, Top panel shows 7-day incidence per week for Germany, and bottom panel shows data for the city of Wuerzburg. B, Graphs shows rate of attendance of children in participating day care centers (DCCs) during the observation period. Data are the average attendance rate on Wednesdays of at least 8 of 9 DCCs.
