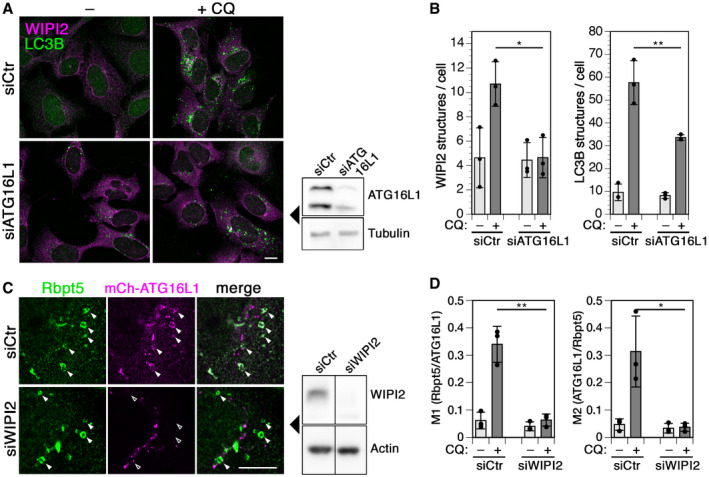
Figure EV3. Interdependence of WIPI2 and ATG16L1 recruitment to chloroquine‐damaged endosomes.

-
A, BCells were transfected with control siRNA (siCtr) or siRNA silencing ATG16L1, treated without (–) or with 60 µM chloroquine (+CQ) for 150 min, fixed, and stained for WIPI2 and LC3B (A). Scale bar, 10 µm. Efficiency of ATG16L1 knockdown was assayed by immunoblotting on the right. WIPI2 of LC3B puncta per cell was quantified for each condition (mean ± SD of three independent experiments; two‐tailed Student’s t‐test: *P < 0.05, **P < 0.01).
-
CHEK+Rbpt5 cells were transfected with nontargeting siRNA (siCtr) or siRNAs silencing WIPI2 (siWIPI2) for 72 h and with mCherry‐ATG16L1 for 24 h. Cells were treated without or with 60 µM chloroquine (+CQ) for 30 min and stained for Rabaptin5 and mCherry‐ATG16L1. Fluorescence micrographs of chloroquine‐treated cells are shown (left panel). Scale bar, 10 µm. Arrowheads point out chloroquine‐induced enlarged early endosomes. The efficiency of WIPI2 knockdown was assayed by immunoblotting using actin as a loading control (middle panel).
-
DManders’ colocalization coefficients were determined, M1 showing the fraction of Rabaptin5‐positive structures also positive for mCherry‐ATG16L1 and M2 showing the inverse. Mean ± SD of three independent experiments; ANOVA: *P < 0.05, **P < 0.01.
