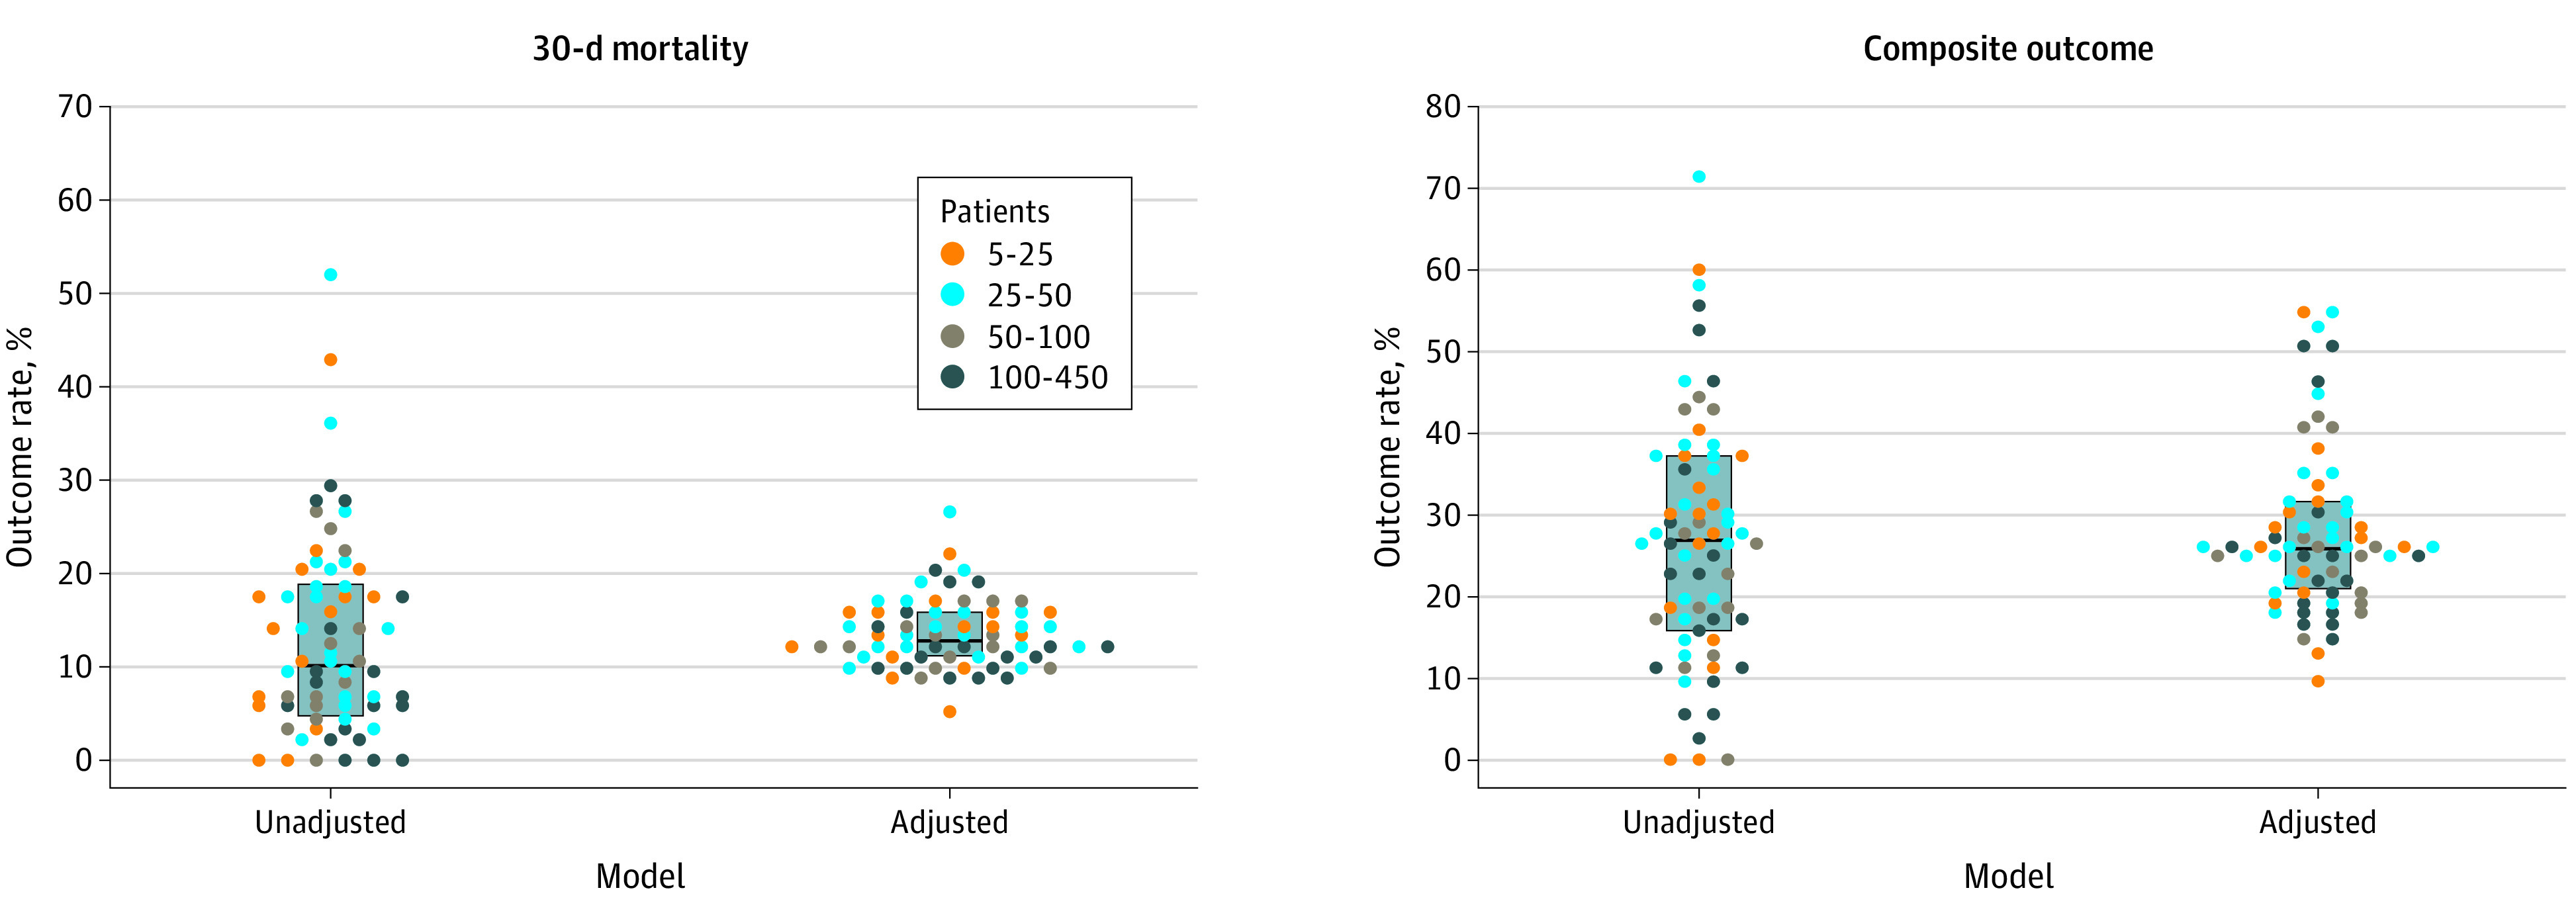
Figure 1. Center-Level Unadjusted and Adjusted Rates of 30-Day All-Cause Mortality and Secondary Composite Outcome (Receipt of Mechanical Ventilation, Intensive Care Unit Admission, and All-Cause Death).

Each dot represents a center, colored according to the number of patients reported to the COVID-19 and Cancer Consortium and included in this analysis. Dots are not displayed for 6 centers with fewer than 5 patients. Median and interquartile range are denoted by the center line and box, respectively. Estimated standard deviation of the center-level random intercepts: 0.555 and 0.837 (on the log-odds scale) for 30-day mortality and the composite outcome, respectively.
