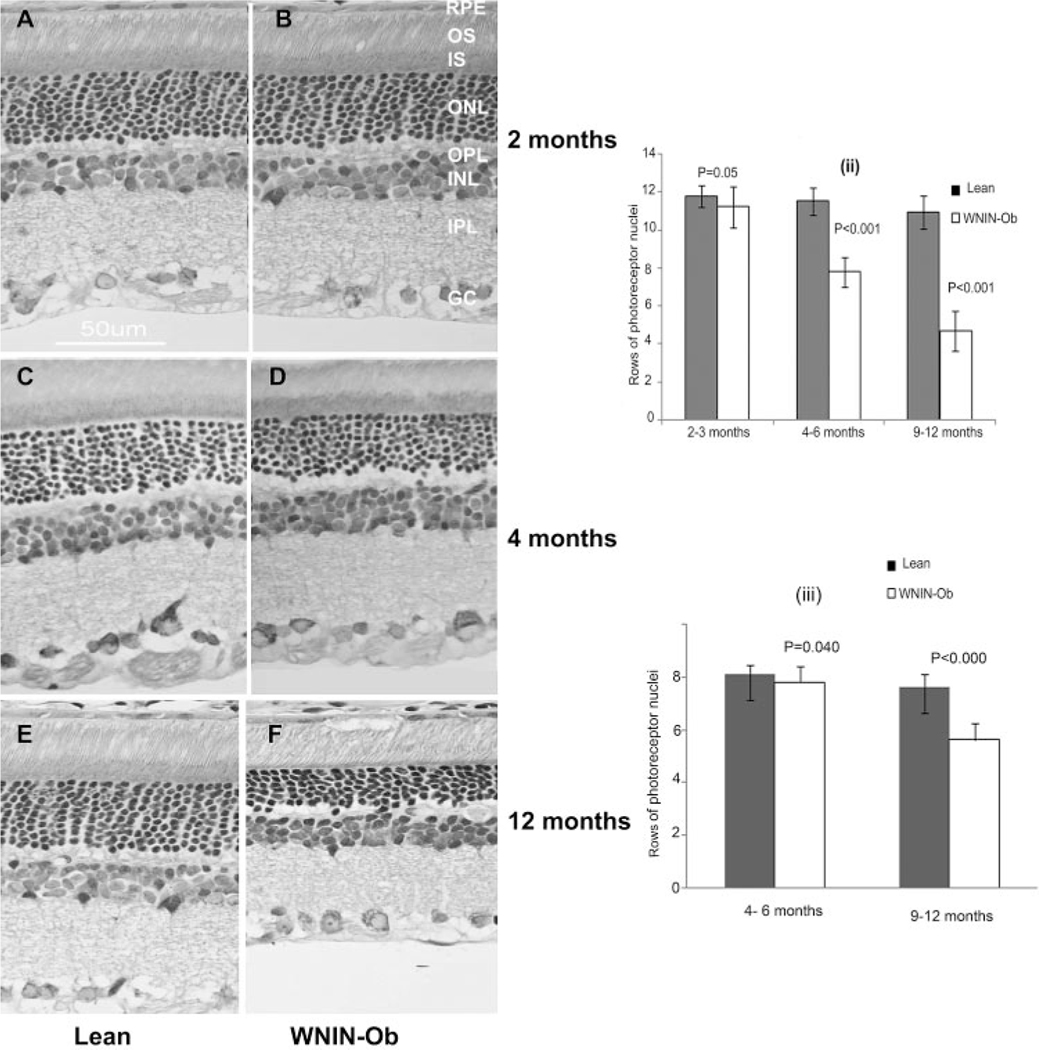
FIGURE 2.
Representative histology of control rat retina (A, C, E) and WNIN-Ob rat retina (B, D, F) at various ages: (A) 2-month-old control; (B) 2-month-old WNIN-Ob; (C) 4-month-old control; (D) 4-monthold WNIN-Ob; (E) 12-month-old control; (F) 12-month-old WNIN-Ob. Histograms summarizing the progression of retinal degeneration in central (ii) and peripheral (iii) retina of WNIN-Ob rats compared with lean controls. Values represent mean ± SD of at least seven independent observations. OS, outer segments; IS, inner segments; INL, inner nuclear layer; IPL, inner plexiform layer; GC, ganglion cell layer.

