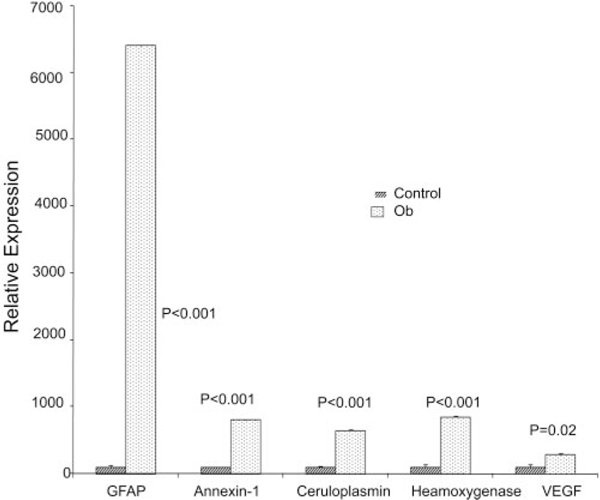
FIGURE 8.
Quantitative expression of selected stress-related genes in retinas of 12-month-old WNIN-Ob rats and their lean littermate controls. Expression values were determined by qRT-PCR and presented on arbitrary scale (y-axis) after normalization with rat Hgprt. Data represent the mean (±SD) on an arbitrary scale and were calculated from at least three independent observations.

