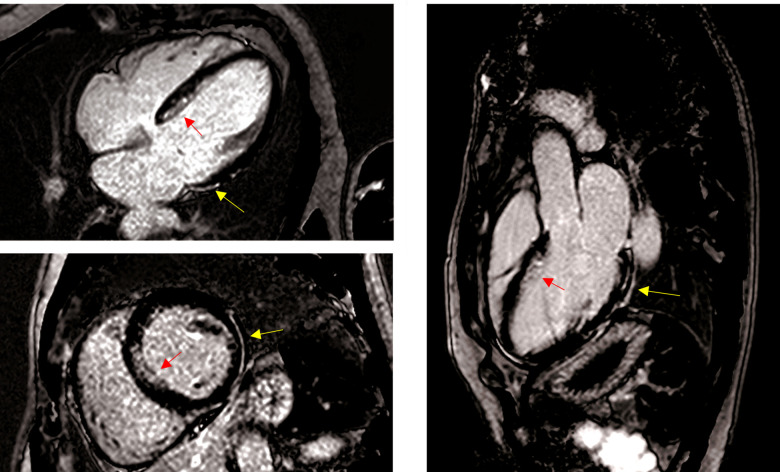
Figure 1.
Late gadolinium enhancement cardiovascular magnetic resonance images showing horizontal long axis (four-chamber) (A) mid-ventricular short axis (B) and left ventricular outflow tract (three-chamber) (C) views. The yellow arrows indicate regions of epicardial lateral fibrosis and the red arrows point to septal subendocardial enhancement.

