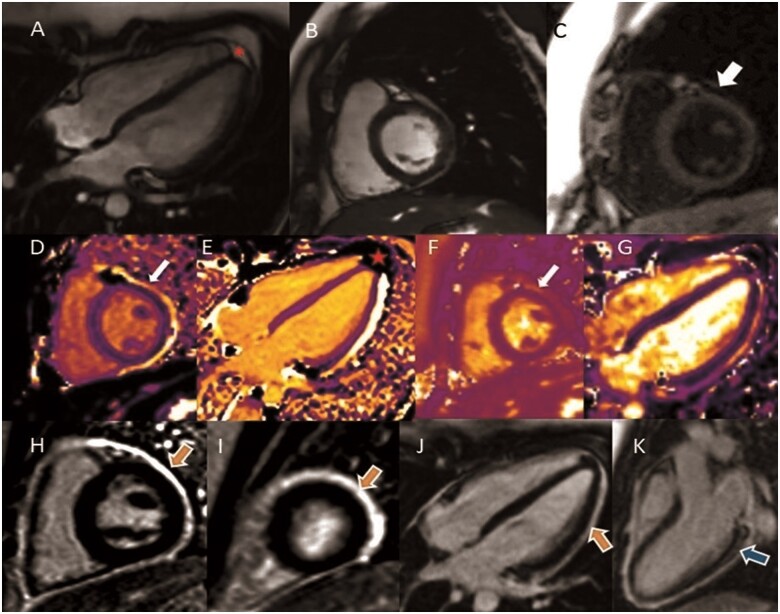
Figure 1.
Steady-state free precession (SSFP) sequence in long-axis (A) and short-axis (B). (C) Black blood T1 weighted (double inversion recovery) showing maximum pericardium thickness of 2.5 mm (arrow). Native T1 mapping [980 ms—normal value 990.66 (17.5) ms] in short-axis (D) and long-axis (E), contributing to differentiate between fat (red star) from fluid/inflammation (bright/arrow). (F) Native T2 mapping sequence showing pericardial inflammation (arrow). (G) Increased myocardium native T2 mapping [52 ms—normal value 47.69 (4.28) ms], suggestive of concomitant myocardial oedema. (H–K) Late gadolinium enhancement (LGE) sequence in short-axis (median and apical slices) and long-axis views showing hyperenhancement in the pericardium (orange arrows) and in myocardium (subepicardial pattern in the basal infero-lateral wall—blue arrow).

