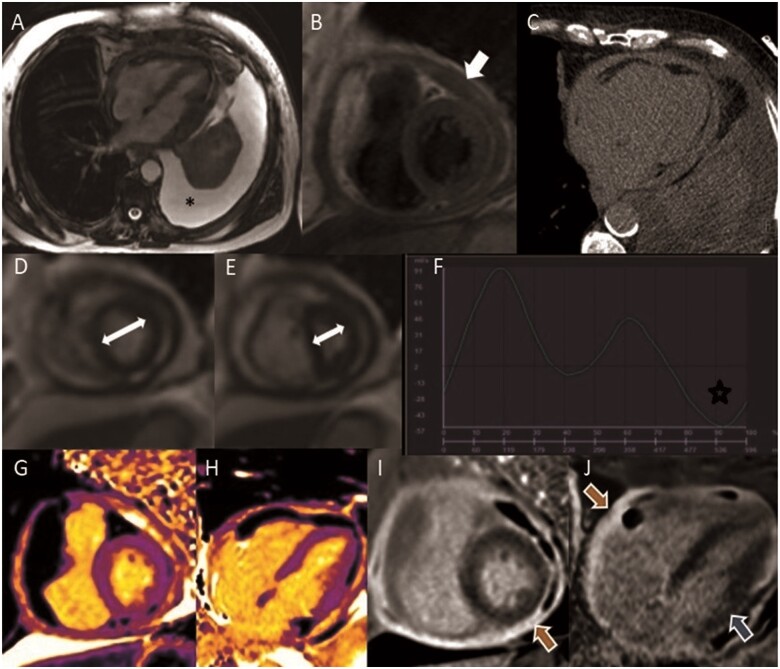
Figure 2.
Cardiac magnetic resonance study of Case 2 constrictive pericarditis. (A) Steady-state free precession sequence, noticing the large left pleural effusion (*). (B) Black blood T1 weighted Turbo Spin Echo sequences showing circumferential thickening of the pericardium (arrow). (C) Computed tomography scan excluded calcification of the pericardium. (D, E) Real-time cine imaging functional assessment of ventricular inter-dependence (D) normal septal position during expiration and (E) marked leftward septal shift seen immediately after deep inspiration (white arrows demonstrate the relative change in cavity size due to the septal shift). (F) Phase contrast study showing reverse diastolic flow in inferior vena cava (star). (G and H) Native T1 mapping with high native T1 values in the pericardium. (I and J) Late gadolinium enhancement sequence in short-axis view and four-chamber view with severe hyperenhancement in the pericardium (orange arrow) and in the myocardium (subendocardial pattern in the basal inferolateral wall—blue arrow).

