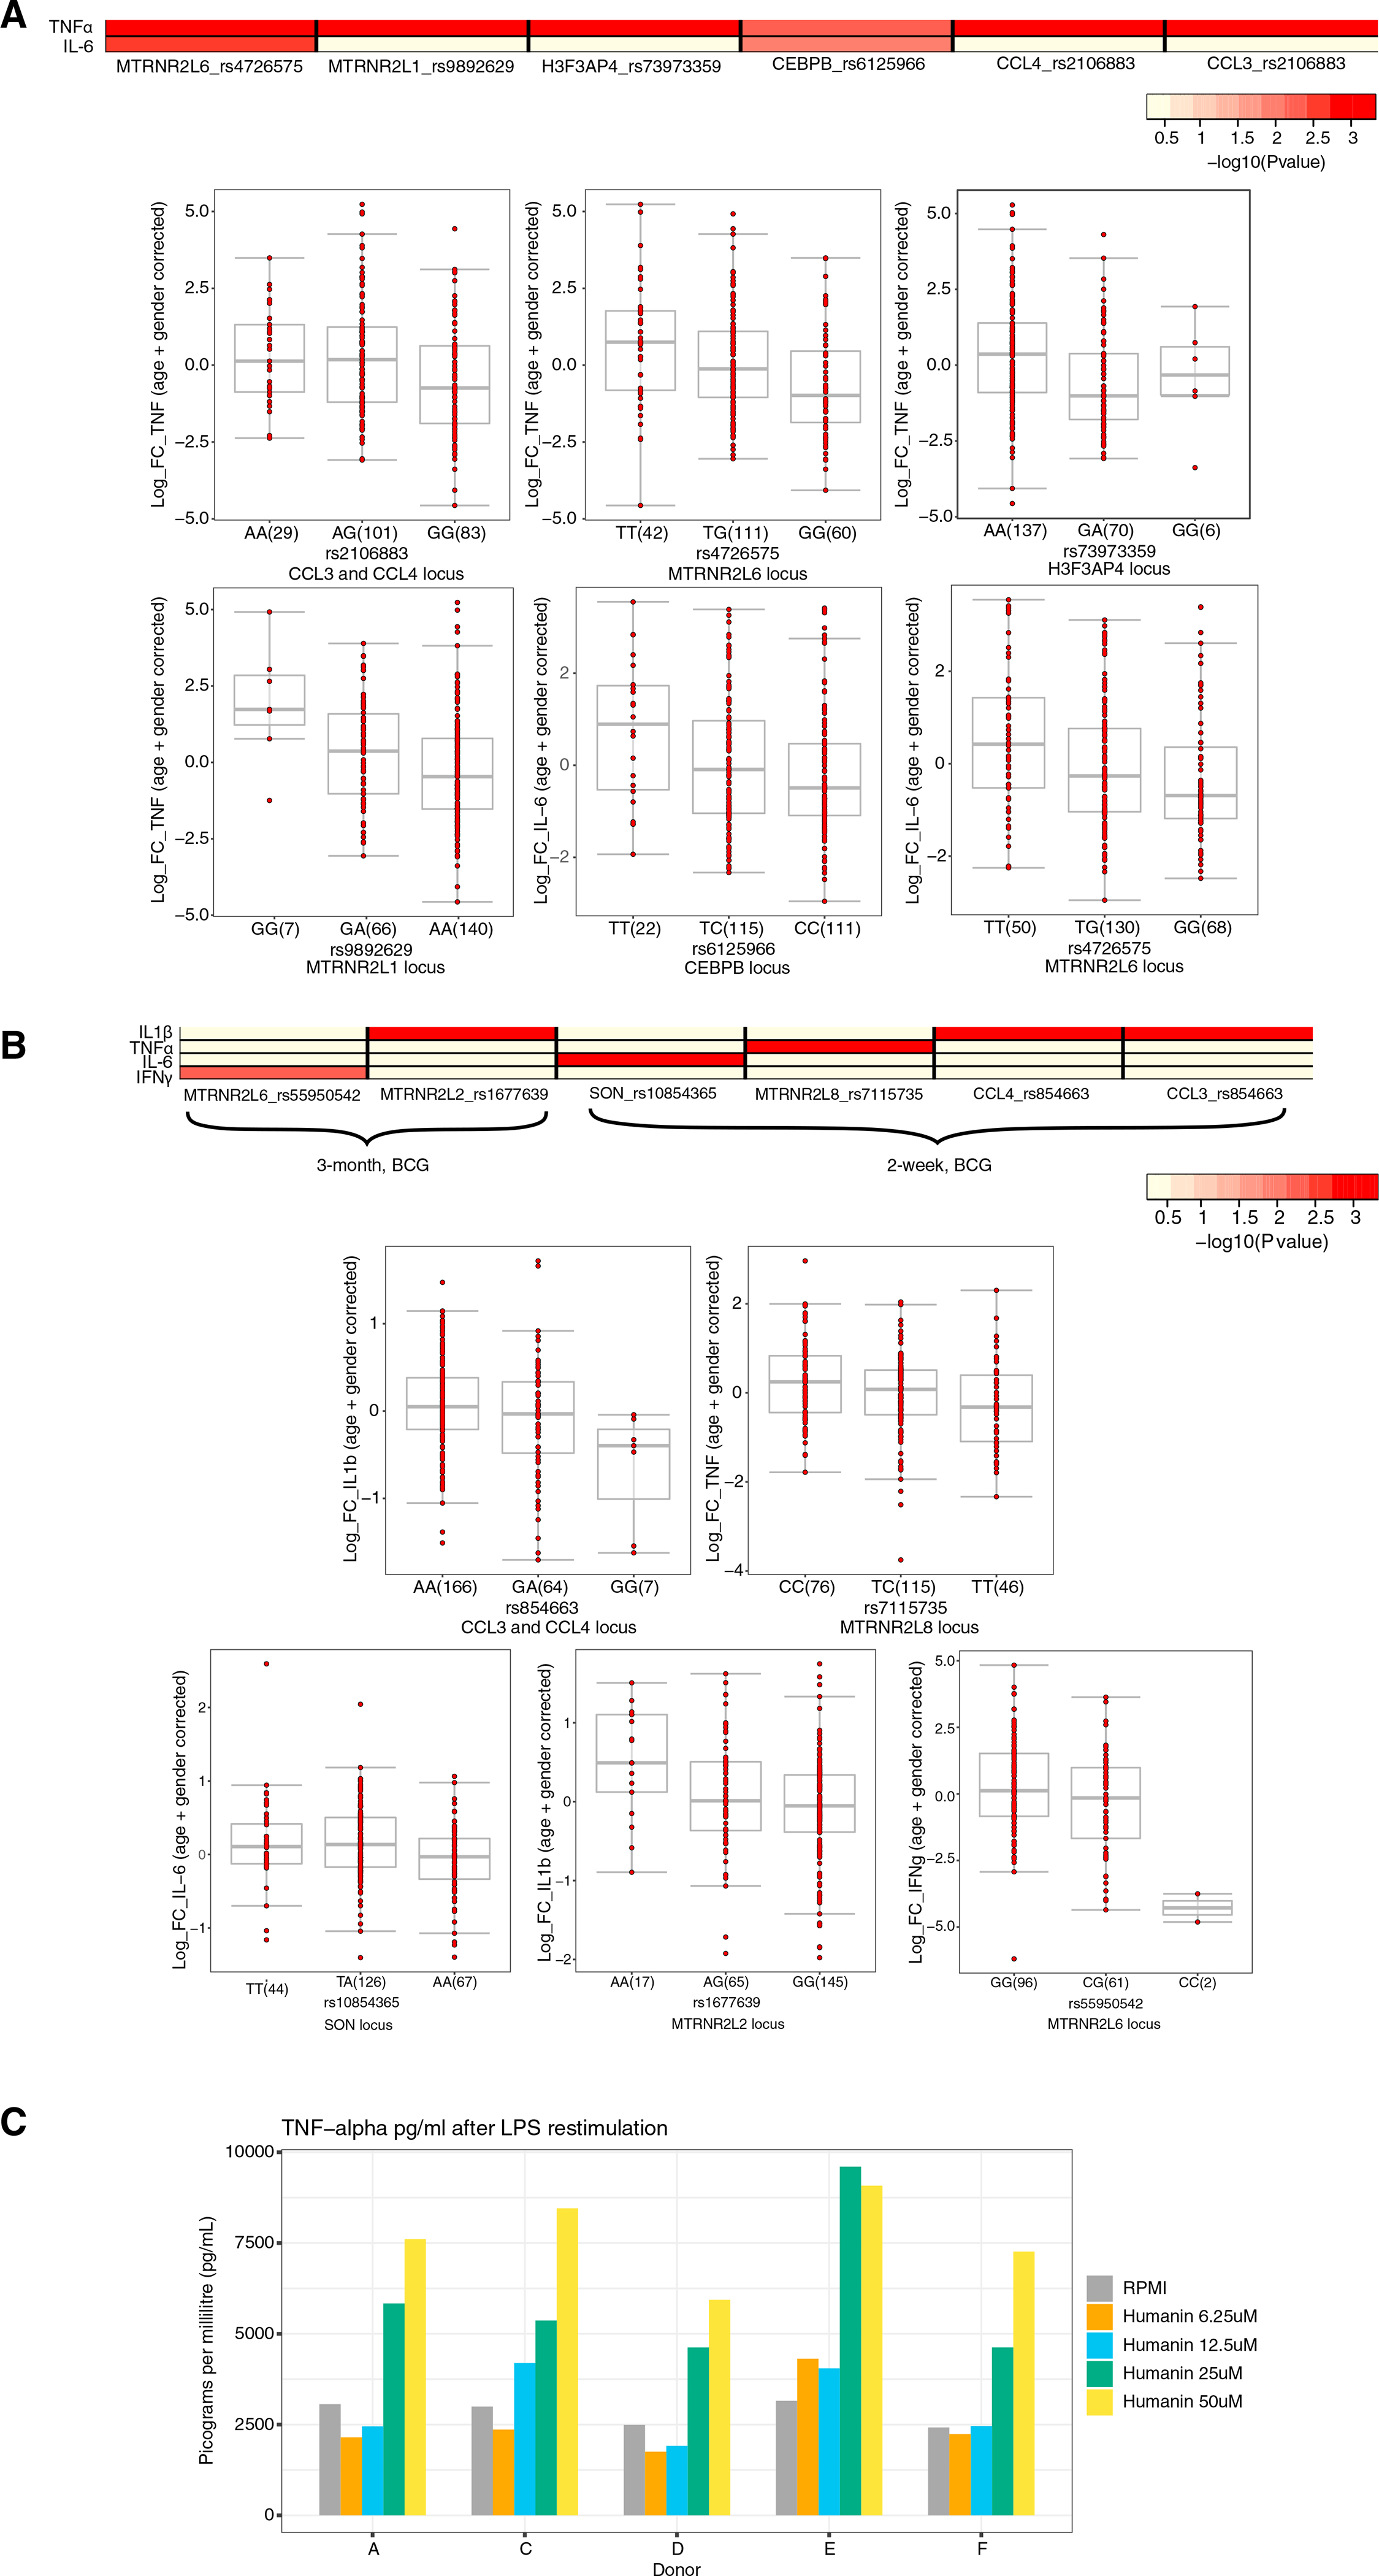
Figure 5. Genetic validation.

(A) Heatmap of the p values of association between SNPs mapped within a window of 100 kb around genes that were significantly differentially expressed at a single-cell level and the magnitude of cytokine production capacity by monocytes trained with BCG in vitro isolated from 300BCG cohort. Boxplots show the genotype-stratified cytokine changes from monocytes trained with BCG. Boxplots show median, upper, and lower quartiles, and whiskers extend to the most extreme point less than 1.5 times the interquartile range from the box.
(B) Similar to (A), although with S. aureus stimulated PBMCs isolated from healthy volunteers (300BCG) 2 weeks and 3 months after BCG vaccination. A linear regression model was used with age and sex as covariates to identify associations between SNPs and cytokine log fold-changes. A detailed description of the QTL mapping using the in vitro and ex vivo trained immunity responses is provided in the STAR Methods section “Genetic validation using the 300BCG cohort.” Boxplots show median, upper, and lower quartiles, and whiskers extend to the most extreme point less than 1.5 times the interquartile range from the box.
(C) TNF-α expression after stimulation with LPS of monocytes that were incubated with varying concentrations of recombinant humanin.
