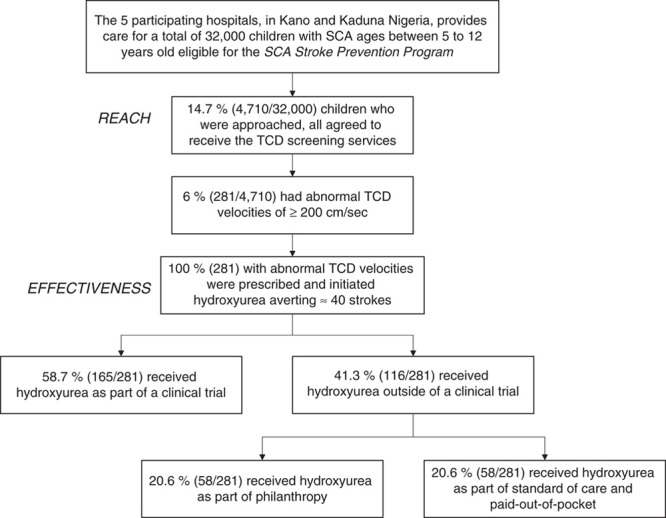
FIGURE 2.

Flow diagram describing: (1) Program Reach defined as the proportion of children followed in the sickle cell disease clinics at the 5 hospitals receiving transcranial Doppler (TCD) screening as standard care; and (2) Program Effectiveness, defined as the number of children with abnormal TCD velocities at risk for an initial stroke who initiated hydroxyurea treatment as a form of primary stroke prevention, at the 4 hospitals in Kano and 1 hospital in Kaduna, Nigeria. SCA indicates sickle cell anemia.
