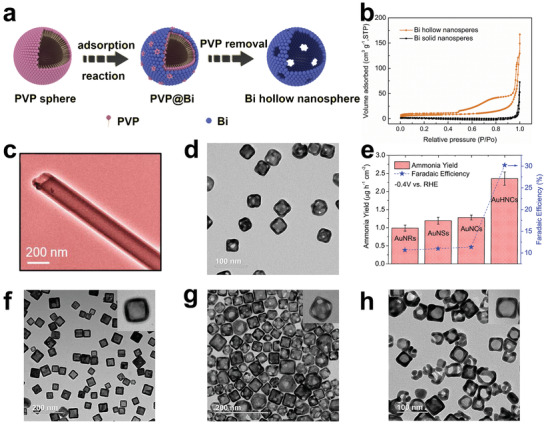
Figure 6.

a) Schematic diagram of the synthesis of Bi hollow nanospheres. b) N2 adsorption/desorption isotherms of different samples. Reproduced with permission.[ 130 ] Copyright 2020, Elsevier. c) TEM image of CoPc NTs. Reproduced with permission.[ 137 ] Copyright 2021, American Chemical Society. d) TEM image of AuHNCs. e) NH3 yields and FEs of different catalysts. Reproduced with permission.[ 31 ] Copyright 2018, Elsevier. f) TEM image of AuHNC‐635. g) TEM image of AuHNC‐715. h) TEM image of AuHNC‐795. Reproduced with permission.[ 138 ] Copyright 2018, American Chemical Society.
