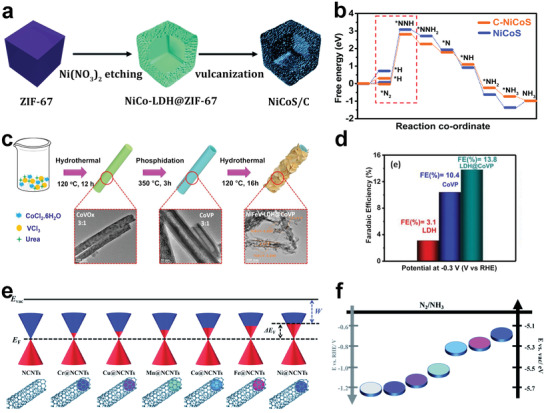
Figure 8.

a) Schematic illustration of the formation process of NiCoS/C nanocage. b) Free energy diagram of N2 reduction on NiCoS/C and NiCoS. Reproduced with permission.[ 161 ] Copyright 2020, Royal Society of Chemistry. c) Schematic diagram for the synthetic procedure of CoVP@NiFeV–LDHs. d) FEs for NiFeV–LDHs, CoVP, and CoVP@NiFeV–LDHs. Reproduced with permission.[ 162 ] Copyright 2020, Elsevier. e) Schematic illustration of the design concept of work function of M@NCNTs. E vac and E F represent vacuum level and Fermi level, respectively. f) The corresponding energy level diagram. Reproduced with permission.[ 163 ] Copyright 2020, Royal Society of Chemistry.
