
Figure 9.
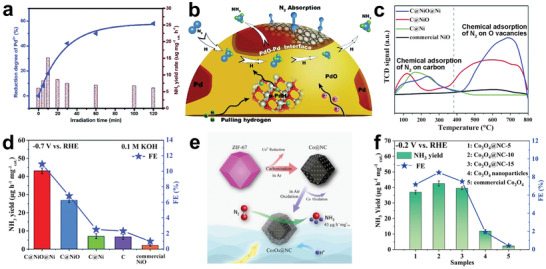
a) Reduction degree and NH3 yield rates of PdO/CNTs with different irradiation times. b) Alternative hydriding pathway for NRR on the PdO–Pd interface. Reproduced with permission.[ 164 ] Copyright 2019, Royal Society of Chemistry. c) N2‐TPD profiles of different catalysts. d) NH3 yield rates and FEs of different catalysts at −0.7 V versus RHE. Reproduced with permission.[ 165 ] Copyright 2020, Royal Society of Chemistry. e) Schematic illustration of the preparation of core–shell Co3O4@NC. f) NH3 yield rates and FEs of different catalysts at −0.2 V versus RHE. Reproduced with permission.[ 166 ] Copyright 2019, American Chemical Society.