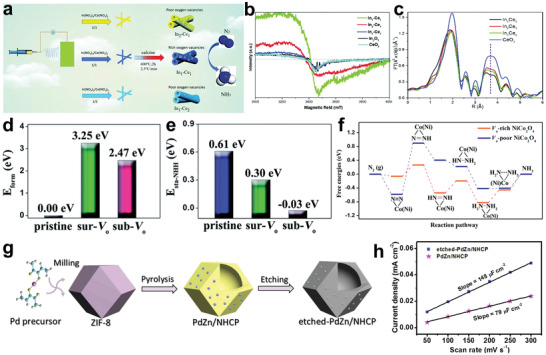
Figure 11.

a) Schematic illustration of the formation of the Vo‐rich In2O3− x /CeO2− y . b) EPR spectra of the different catalysts. c) EXAFS signals in R‐space of the catalysts. Reproduced with permission.[ 185 ] Copyright 2020, Royal Society of Chemistry. d) Formation energy of oxygen vacancy for different catalyst models. e) Adsorption energy of NNH groups in different catalyst models. f) Free energy diagram of Vo‐rich NiCo2O4@HNCP. Reproduced with permission.[ 186 ] Copyright 2020, Royal Society of Chemistry. g) Schematic diagram of the formation process of etched‐PdZn/NHCP. h) Capacitive currents versus scan rates for different catalysts. Reproduced with permission.[ 188 ] Copyright 2020, Elsevier.
