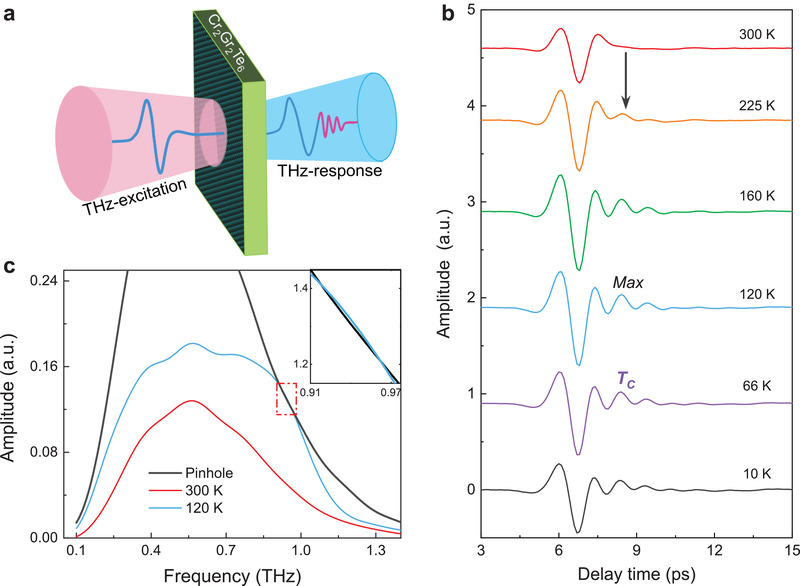
Figure 1.

Terahertz responses of Cr2Ge2Te6 crystal. a) Schematic diagram of the transmission measurement configuration. b) Time‐resolved THz spectra transmitted through the sample at some critical temperatures. c) Frequency‐domain THz spectra corresponds to temperatures of 300 K (red curve) and 120 K (blue curve). The black curve is the reference THz signal through the pinhole of the sample holder without any sample. The inset is the close‐up view of the red dashed frame area at 120 K.
