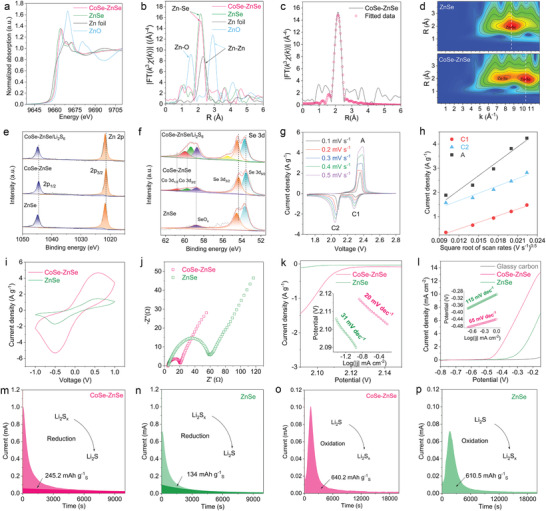
Figure 3.

a,b) XANES spectra and FT‐EXAFS spectra at the Zn K‐edge for the CoSe–ZnSe, ZnSe, ZnO, and Zn powders. c) FT‐EXAFS fitting curves of the CoSe–ZnSe at Zn K‐edge. d) WT‐EXAFS spectra of the CoSe–ZnSe and ZnSe. e) Zn 2p and f) Se 3d XPS spectrums of ZnSe, CoSe–ZnSe, and CoSe–ZnSe/Li2S6. g) CV curves of the CoSe–ZnSe/S electrode at various voltage scan rates. h) Plot of CV peak current versus square root scan rates for CoSe–ZnSe/S electrode. i) CV and j) EIS of Li2S6 symmetric cells. k) CV curves and C2 reduction peak derived Tafel plots as inset. l) LSV curves with the derived Tafel plots as inset. m,n) Precipitation profiles of Li2S. o,p) The dissolution profiles of Li2S.
