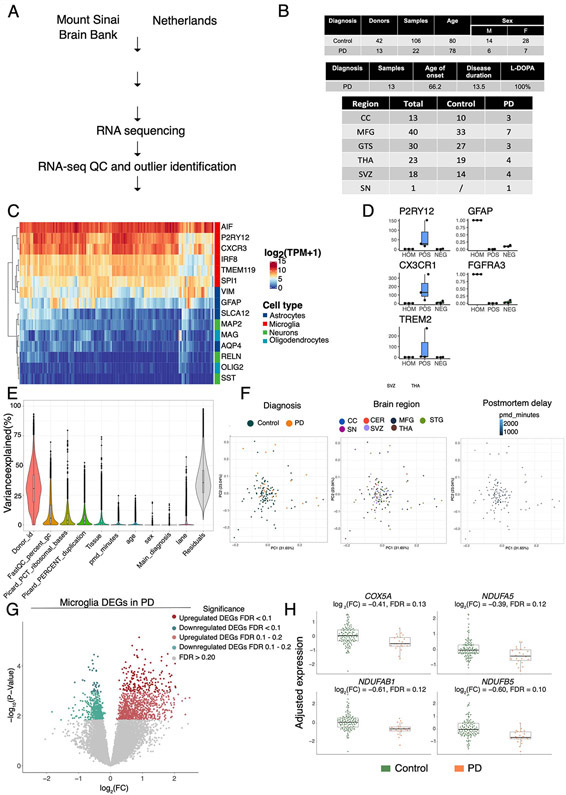
Extended Data Fig. 6. Fresh microglia transcriptome analysis.
Microglia transcriptomic profiling was performed from 22 samples from 13 PD donors and 106 samples from 42 control donors. (A) Experimental workflow for the generation of human microglial transcriptomic profiles (B) Tables describing the samples included in the study (top: demographic information, middle: clinical information, bottom: brain regions). CC: Corpus Callosum; MFG: medial frontal gyrus; STG: Superior temporal gyrus; THA: thalamus; SVZ: subventricular zone; SN: substantia nigra (C) Heatmap for the expression of marker genes of different brain cell types (red: microglia, dark blue: astrocytes, green: neurons, light blue: oligodendrocytes). (D) Microglial isolation purity assessed by qPCR comparing the brain homogenate, and the positive and negative fractions after CD11b magnetic beads comparing microglial markers (P2RY12, CXCR1, TREM2) and astrocytic markers (GFAP, FGFR3). (E) Violin plot showing the % of variance (y-axis) explained by known covariates (x-axis) by variancePartition. Each dot represents a gene. (F) PCA after regressing out covariates colored by diagnosis (left panel), brain region (middle panel), postmortem interval (right panel). n=128 samples from 55 independent donors. (G) Volcano plot showing the fold-change of genes (log2 scale) between PD-microglia (22 samples from 13 donors) and controls (106 samples from 42 donors) (x-axis) and their significance (y-axis, −log10 scale). Moderated t-statistic (two sided) is used for statistical test (see R package DREAM).(H) Expression of selected mitochondria-specific genes in microglia. Adjusted gene expression levels after normalization are shown. Boxplots: the line represents the median. The boxes extend from the 25th - 75th percentile and the lines extend 1.5 times the interquartile range. n=128 samples from 55 independent donors.

