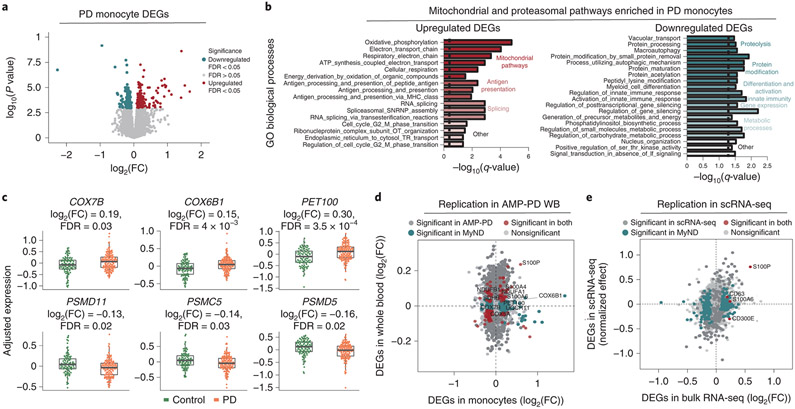
Figure 2. Transcriptomic analysis of PD-derived monocytes and age-matched controls.
(A) Volcano plot showing the fold-change (FC) of genes (log2 scale) between PD-monocytes (n=135) and controls (n=95) (x-axis) and their P-values significance (y-axis, −log10 scale). DEGs at FDR < 0.05 are highlighted in red (upregulated genes) and blue (downregulated genes). Moderated t-statistic (two-sided) is used for statistical test. (B) Pathway analysis for the upregulated (left panel) and downregulated (right panel) DEGs. Significance is represented in the x-axis (−log10 scale of the q-value). Only the 20 most significant pathways (FDR q-value < 0.05) with a minimum of 5 genes overlap are shown. Pathways are grouped and colored by biologically-related processes. n=230 independent samples (C) Examples of selected mitochondrial (top panel) and proteasomal (bottom panel) DEGs. Adjusted expression of the voom normalized counts after regressing covariates is shown. Boxplots: the line represents the median. The boxes extend from the 25th - 75th percentile and the lines extend 1.5 times the interquartile range. n=230 (D) Fold-change (log2 scale) correlation of DEGs between MyND monocytes (x-axis) and AMP-PD whole blood (y-axis). Genes are colored by significance, considering significant DEGs at FDR < 0.05. (E) Fold-change (log2 scale) correlation of DEGs between bulk monocytes (x-axis) and single-cell across-clusters analysis (y-axis). Four outlier genes were removed for easier visualization. Genes are colored by significance, considering significant DEGs at q-value < 0.05.

