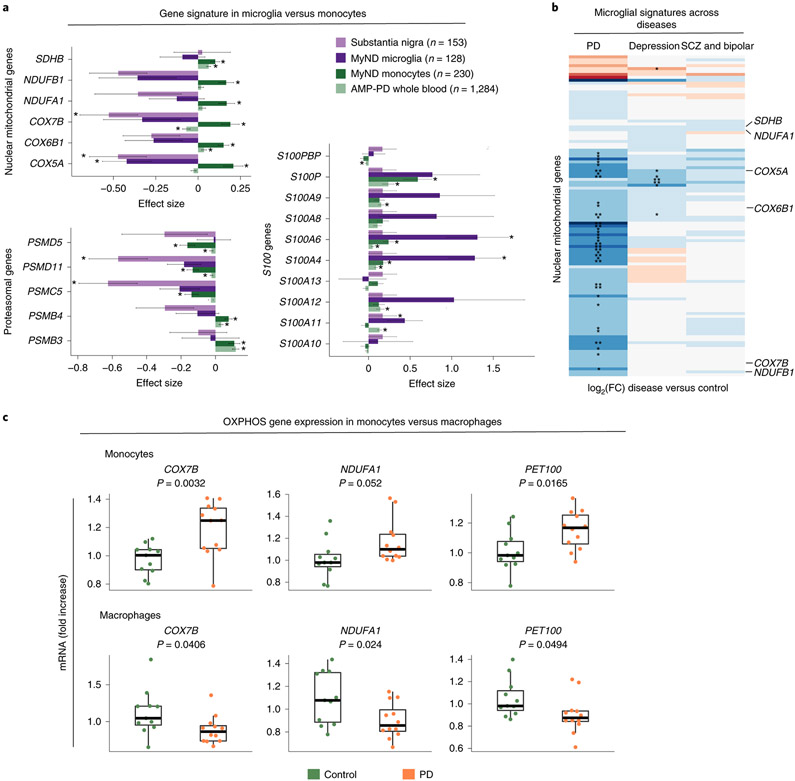
Figure 5. Comparing the transcriptome profiles of PD monocytes and primary microglia.
(A) Effect size (log2[FC]) barplots of PD vs control differential expression in different datasets: substantia nigra (SN; light purple) 43, human microglia from MyND (dark purple), monocytes from MyND (dark green) and whole blood from AMP-PD (light green). Left panel: nuclear mitochondrial genes and proteasomal genes which are DEGs at FDR < 0.05 in monocytes from MyND. Right panel: All S100 genes tested across datasets. Bars indicate +/− SEM. Corrected P-value: *FDR < 0.05 in all datasets; *FDR < 0.15 for microglia MyND. Moderated t-statistic (two-sided) is used for statistical test. (B) Heatmap showing the fold-change (log2 scale) of disease vs controls of OXPHOS genes (y-axis) across different diseases (PD, Depression or Psychiatric disorders [Bipolar and Schizophrenia]). Blue represents log2(FC) < 0 (downregulated genes) and red represents log2(FC) > 0 (upregulated genes) when comparing disease vs. controls. Selected mitochondrial genes are shown. Nominal P-value: * P-value < 0.05; ** P-value < 0.01 for disease vs control differential expression. (C) qPCR validating the top differentially expressed OXPHOS genes (COXB, NDUFA1 and PET100) in monocytes and MDMs of controls (n = 11) and PD patients (n = 12). Graphs represent the fold change expression compared to controls. P-value was calculated via t-test. Boxplots: the line represents the median. The boxes extend from the 25th - 75th percentile and the lines extend 1.5 times the interquartile range.

