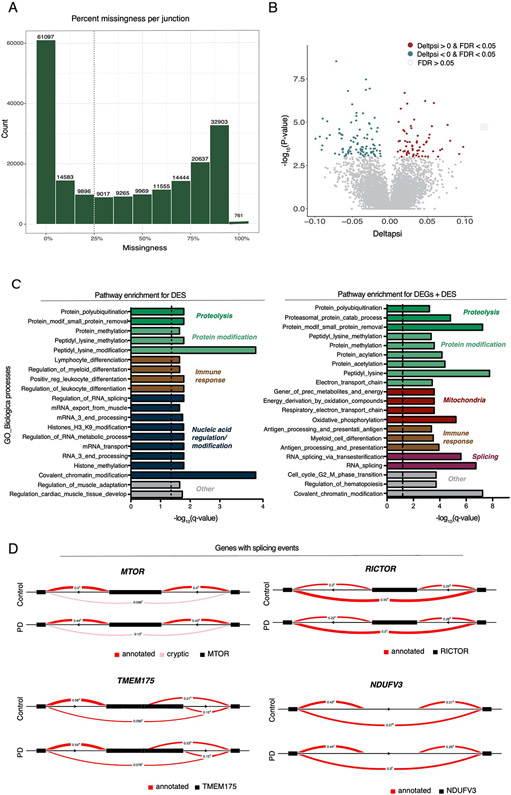
Extended Data Fig. 3. Differential expression analysis at the splicing level in PD and controls derived monocytes.
(A) Histogram reflecting the counts (y-axis) and the % of missingness (x-axis). (B) Volcano plot showing the delta PSI of genes with splicing events in PD-monocytes (n = 135) and controls (n = 95) (x-axis) and their significance in the y-axis (−log10 P-value scale). DSs at FDR < 0.05 are highlighted in red (delta PSI > 0) and blue (delta PSI < 0). Positive delta-PSI indicates that the long isoform is favored whereas negative delta-PSI indicates preference for the short isoform. Chi-squared is used for statistical test (C) Pathway enrichment analysis for the DSs at FDR < 0.0.5 (left panel) DSs + DEGs at FDR < 0.05 (right panel) using Biological processes from GSEA. Significance is represented in the x-axis (−log10 P-value scale of the q-value). Only the 20 most significant pathways (q-value < 0.05) with a minimum overlap of 5 genes are shown. Pathways are grouped and colored by biological related processes. n=230 independent samples. (D) Examples of genes showing significant splicing events.

