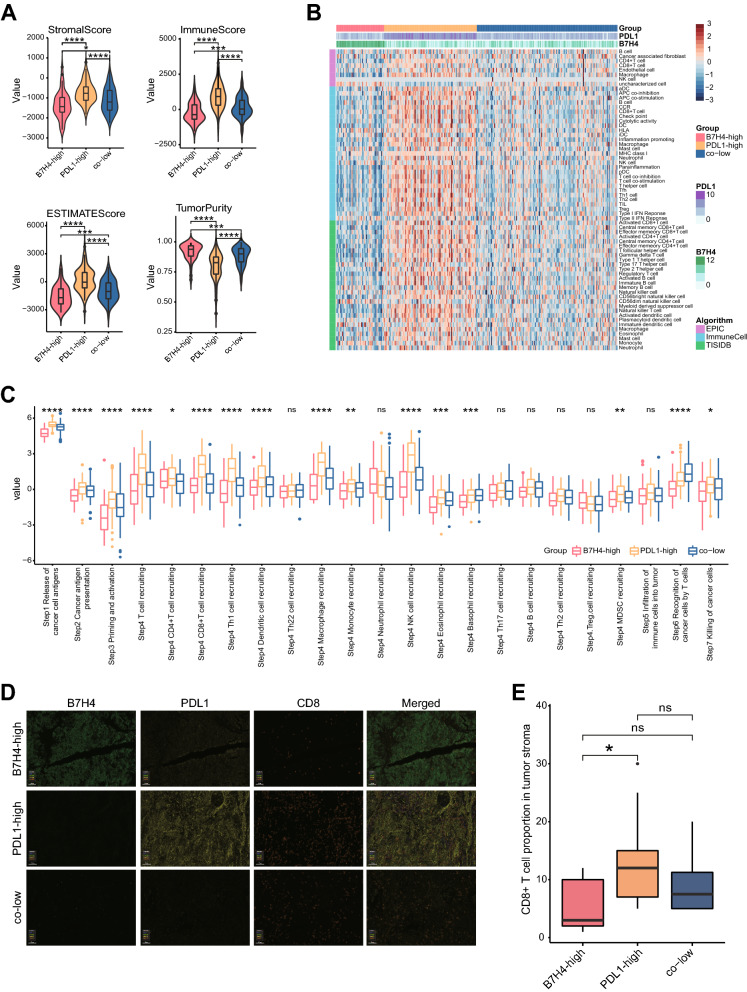
Fig. 4.
Correlations between the B7H4-PDL1 classifier and immunological features in CeCa. A Differences in Tumor Purity, ESTIMATE Score, Immune Score, and Stromal Score estimating by ESTIMATE algorithm in B7H4-high, PDL1-high and co-low subgroups. *P < 0.05; ***P < 0.001; ****P < 0.0001. B Differences in the levels of TIICs calculated using three algorithms in B7H4-high, PDL1-high and co-low subgroups. C Differences in the various steps of the cancer immunity cycle in B7H4-high, PDL1-high and co-low subgroups. Ns: no significant difference; *P < 0.05; **P < 0.01; ***P < 0.001; ****P < 0.0001. D Representative images revealing B7H4, PDL1 and CD8 expression in different subtypes revealed by multiplexed QIF. Magnification, ×200, Bar = 100 μm. E Differences in CD8 + T cell infiltration in B7H4-high, PDL1-high and co-low subgroups

