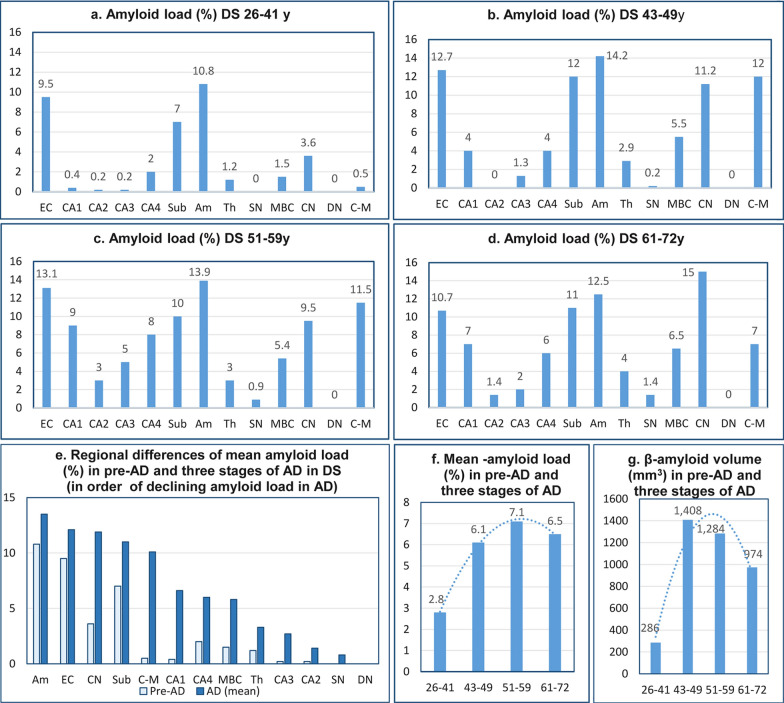
Fig. 9.
Amyloid load (%). Fig. a shows the onset of amyloidosis in pre-AD with marked amyloid load in the entorhinal cortex, amygdala, and subiculum, and much less in the CN, CA4, MBC, and thalamus. Amyloid load increases in a region-specific range and stabilizes to comparable levels in the fourth, fifth, and sixth decades (b-d, respectively). Graph e illustrates grading of regional susceptibility to β-amyloidosis and shows that the pattern in pre-AD predicts severity of regional amyloidosis in next decades. Fig. f and g show a global pattern of onset and progression of amyloidosis in pre-AD and in the fourth and fifth decades but a decrease of amyloid load (%) and amyloid volume (mm3) in the sixth decade of life of DS subjects

