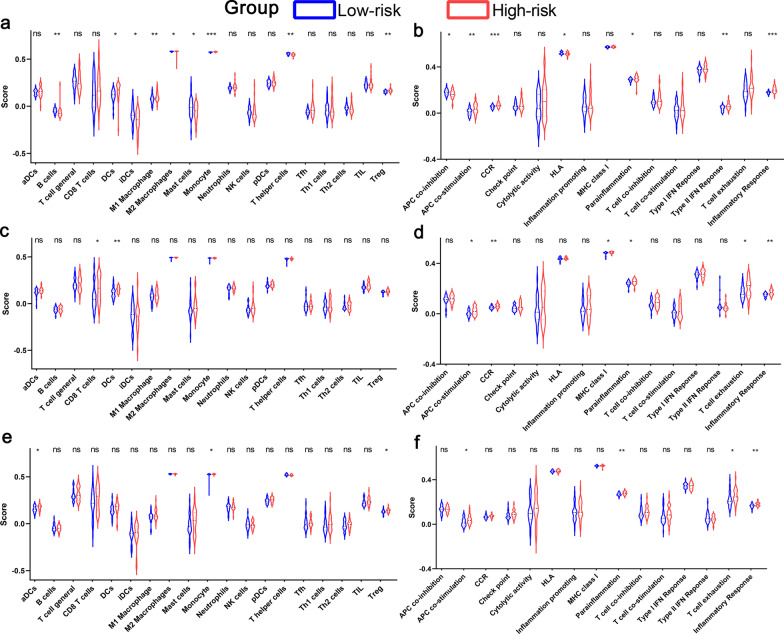
Fig. 8.
Comparison of the ssGSEA scores between low-risk and high-risk groups in the Freiburg cohort (a, b), in the Siena validation cohort (c, d), and in the Leuven validation cohort (e, f). The scores of 19 immune cells (a, c, e) and 15 immune-related functions (b, d, f) are displayed in violin plots. DC, Dendritic Cell; TIL, Tumor infiltrates lymphocytes; CCR, cytokine-cytokine receptor. P values were showed as: ns, not significant; *, P < 0.05; **, P < 0.01; ***, P < 0.001

