Fig. 5.
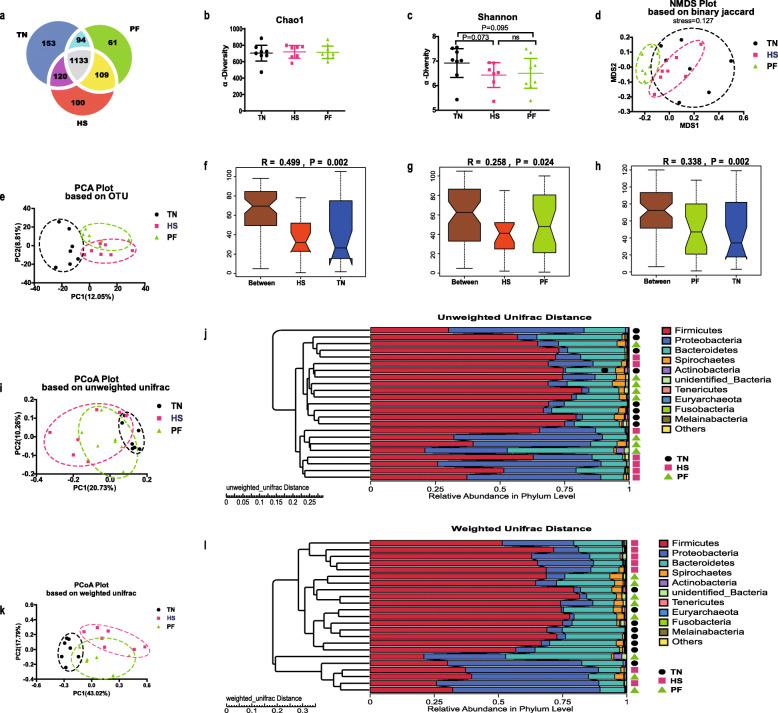
Effects of constant chronic heat stress on intestinal microbial communities. Venn diagram showed the proportion of common and special OTUs among groups (a). Alpha diversity index such as Chao1 (b) and Shannon (c) index indicated the diversity and evenness. Binary-Jaccard distance-based NMDS plot (d), OTUs-based PCA plot (e), unweighted unifrac distance-based PCoA plot (i), weighted unifrac distance-based PCoA plot (k) were used to display the distribution of the samples among groups. ANOSIM test was performed to detect differences in community structure between groups based on OTUs relative abundance (f, g, h). UPGMA clustering was conducted based on unweighted unifrac distance and weighted unifrac distance (j, i). Differences of α-diversity indices were determined by Wilcox rank-sum test, and differences of β-diversity indices were determined by ANOSIM test. * presented P < 0.05, *** presented P < 0.001, ns mean no significant difference. TN, thermal neutral conditions (25 ± 1 °C); HS, heat stress conditions (35 ± 1 °C); PF, pair-fed with HS under TN conditions (25 ± 1 °C). n = 8 for TN and PF, n = 7 for HS

