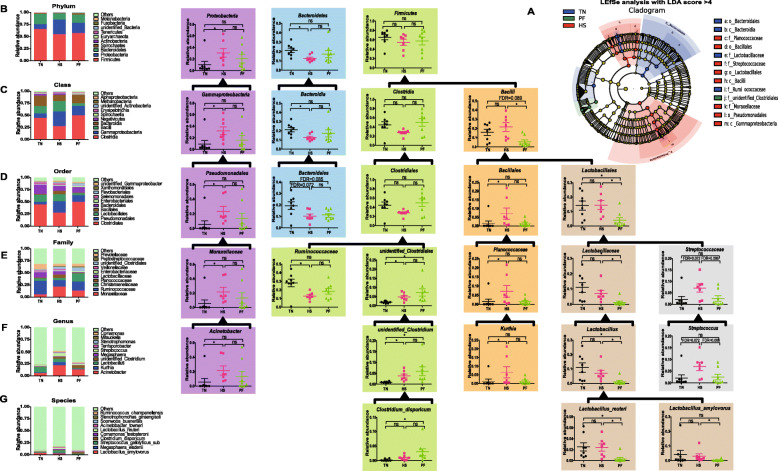
Fig. 6.
Effects of constant chronic heat stress on the relative abundance of microbial species. The LEfSe analysis (LDA score ≥ 4) identified the biomarker species (A). The top 10 phylum, class, order, family, genus, and species and the significantly different microbial at each level were showed (B). TN, thermal neutral conditions (25 ± 1 °C); HS, heat stress conditions (35 ± 1 °C); PF, pair-fed with HS under TN conditions (25 ± 1 °C). Brackets indicated the affiliation between species. Differences were determined by Kruskal-Wallis test followed by Dunn test, and false discovery rate (FDR) values were estimated using the Bonferroni method to control for multiple testing (* presented FDR < 0.05, ns mean no significant difference). n = 8 for TN and PF, n = 7 for HS

