Fig. 2.
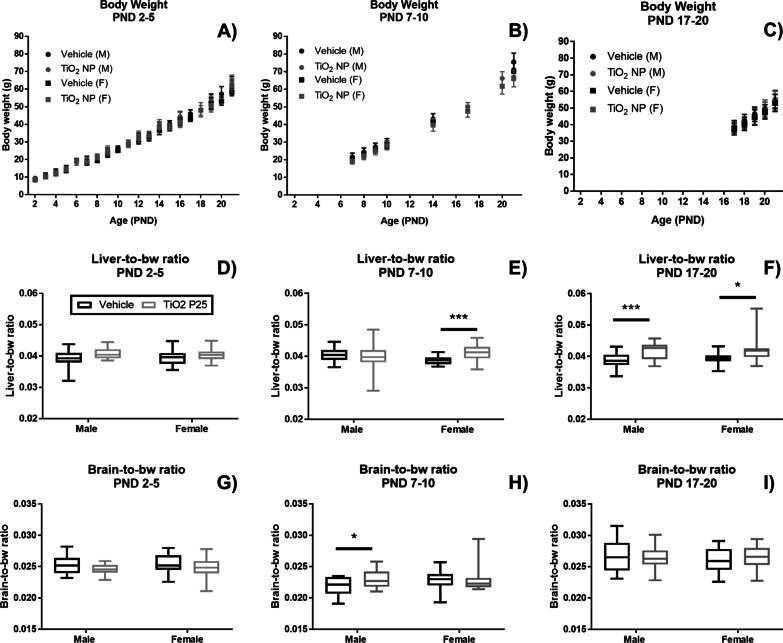
Body weight (bw) (A–C), liver-to-bw ratio (D–F), and brain-to-bw ratio (G–I) were measured for male (n = 15) and female (n = 15) rat pups orally dosed with TiO2 NP and vehicle control between PND 2–5 (A, D, G), PND 7–10 (B, E, H), and PND 17–20 (C, F, I). No changes in bw were observed as a result of TiO2 NP administration. TiO2 NP led to increased liver-to-bw ratio at PND 21 for female pups dosed between PND 7–10 and PND 17–20, while liver-to-bw ratio increased for male pups dosed between PND 17–20. Male pups dosed between PND 7–10 had significantly increased brain-to-bw ratio. Body weight is presented as mean ± standard deviation. Box and whisker plots of organ-to-bw ratio data where the box extends from the 25th to 75th percentile and shows the median value, while the whiskers show the minimum and maximum value. TiO2 NP dose groups are shown in black and vehicle control in gray. Statistical analyses were conducted using Mann–Whitney U test: *P-value < 0.05, **P-value < 0.01, ***P-value < 0.005

