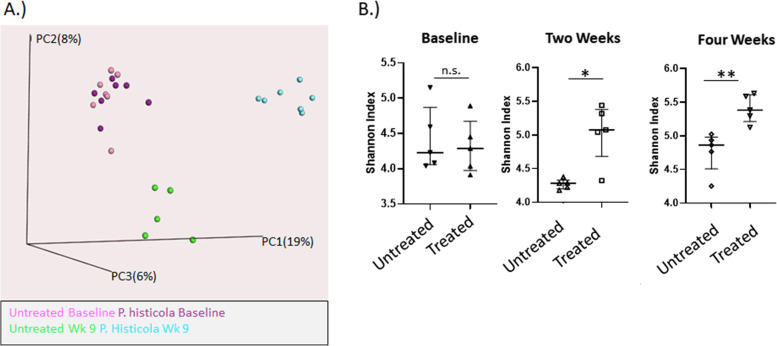
Fig. 4.
A. Beta Diversity Plot of Fecal Microbiomes. Stool was collected at baseline and 9 weeks after administering P. histicola. Beta diversity was depicted in a 3 dimensional principal coordinate plot. The baseline of the untreated mice are depicted in pink, the baseline of the P histicola treated mice is depicted in lavender, the 9 week untreated group is green, and the 9 week P. histicola group is blue. B. Alpha Diversity Plot. Shannon Index is plotted for fecal microbiomes from baseline, 2 weeks, and 4 weeks of P histicola treatment along with corresponding untreated groups. There is an increasing trend of significant difference with time, such that the treated group is significantly higher than untreated at 2 weeks (p < 0.05). At 4 weeks after treatment the difference between the untreated and treated groups is greater (p < 0.01). n = 5 mice for untreated and n = 5 mice for P histicola treated

