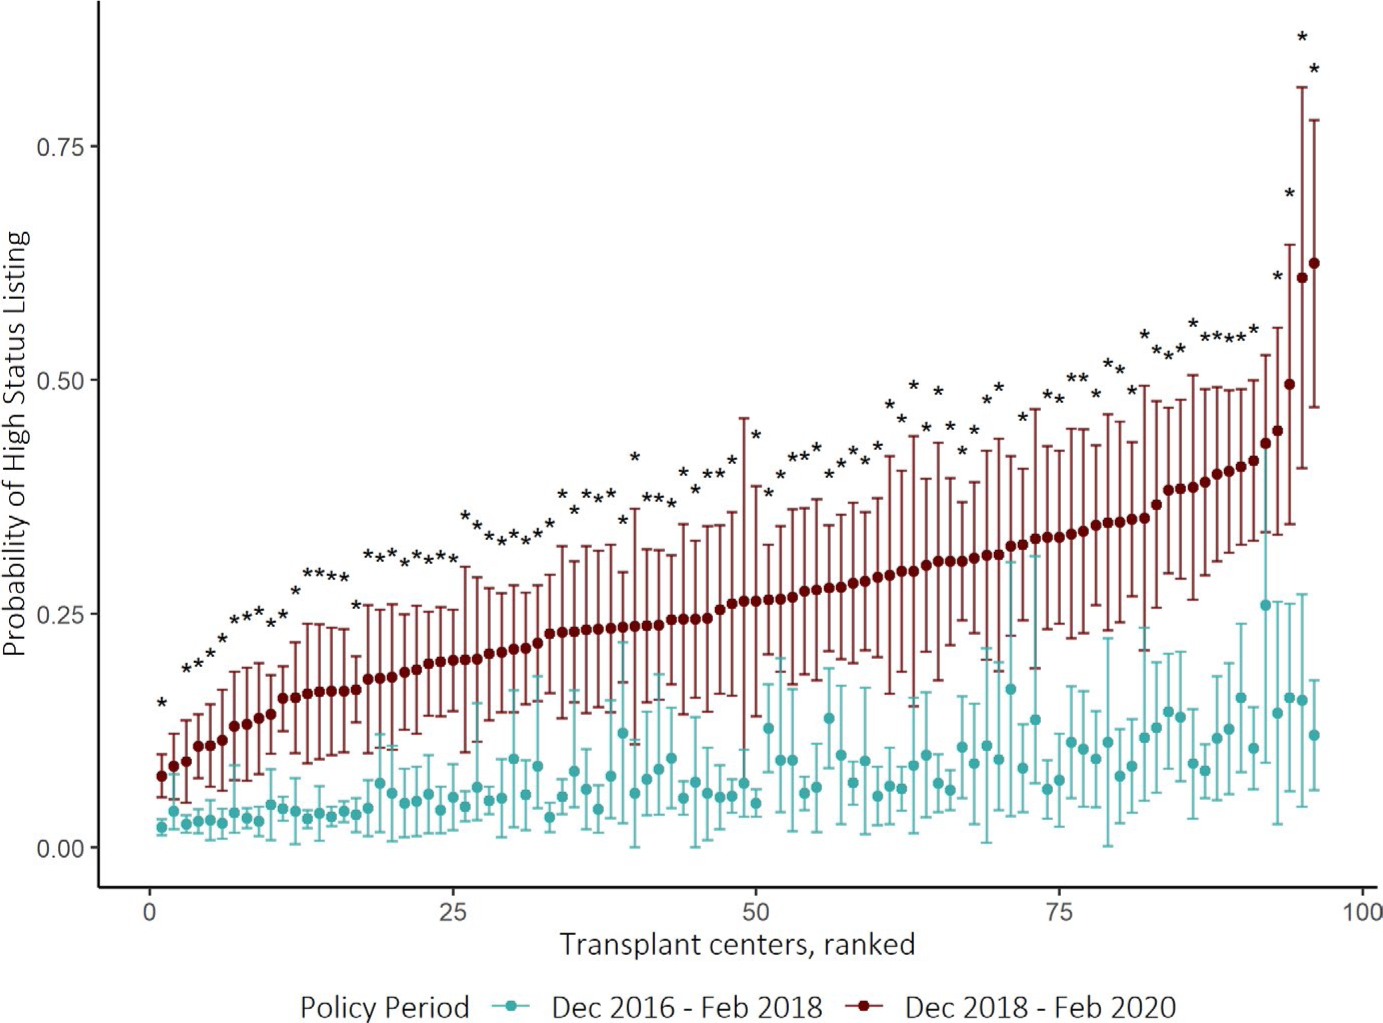
FIGURE 2.

Between-center variation in high-priority status listing after implementation of the new heart allocation policy. Caterpillar plot showing the estimated probability of being listed at high-priority (Status 1 or Status 2) at each transplant center, adjusting for candidate characteristics. Colors correspond to the predicted rate of being listed in high-priority status based on status reclassification of pre-policy candidates (green) and the rate based on observed utilization of high-priority statuses after the policy change (red). The expected rates (green) represent the counterfactual scenario in which center practices did not change in response to the new heart allocation policy. The 95% CIs were constructed via bootstrapping. Transplant centers were ranked based on predicted probability of high-priority listing after policy update. Asterisks indicate centers with statistically significant change in the estimated probability of listing in Status 1 or 2 before and after implementing the new policy. The observed rate significantly exceeded the expected rate in 91 out of 96 centers (94.8%)
