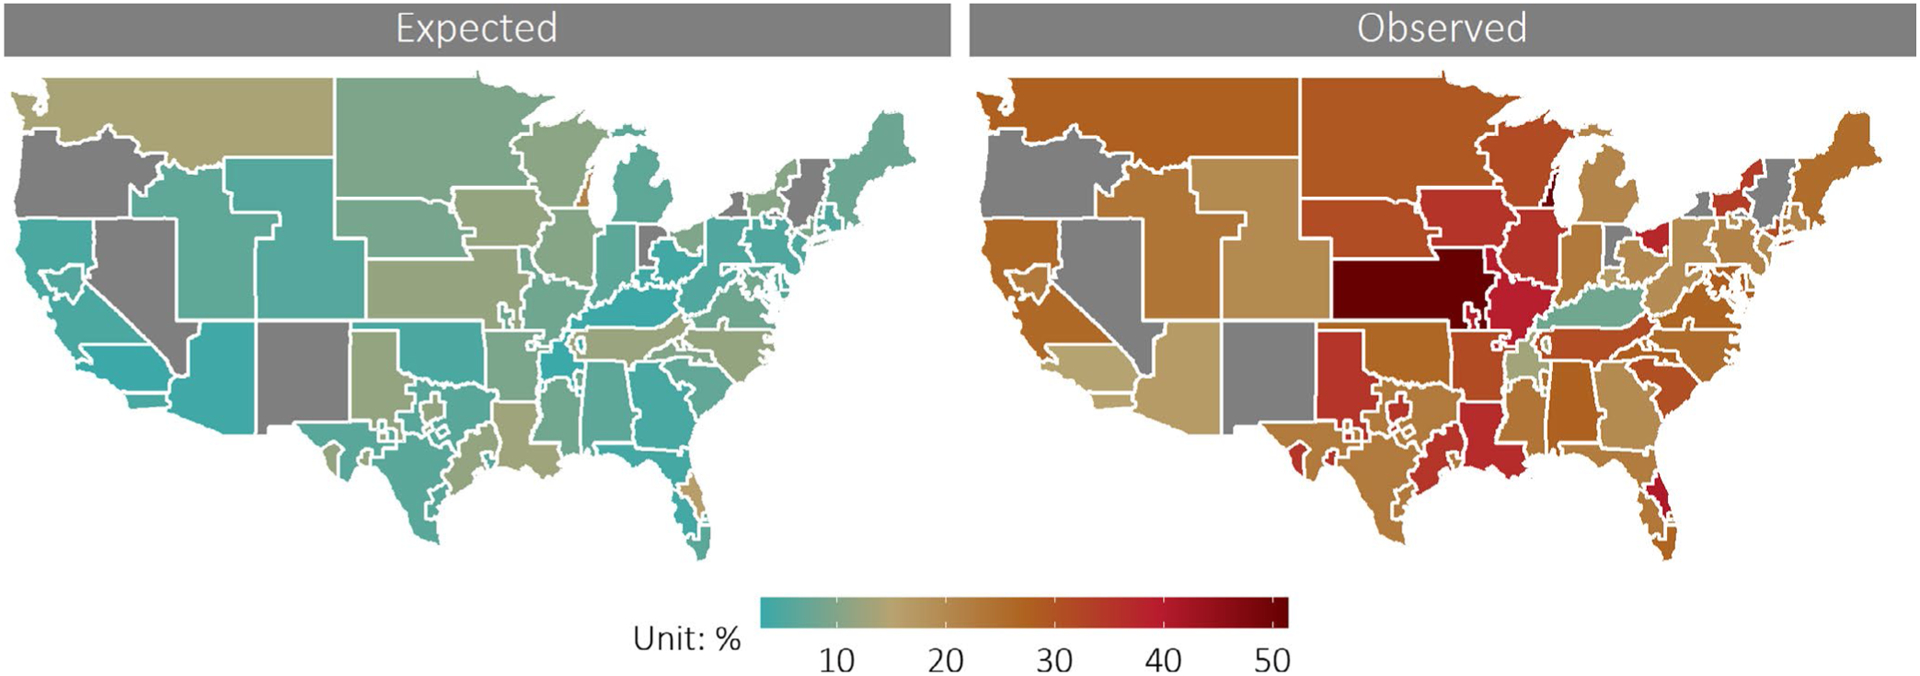
FIGURE 3.

Geographical variation in high-priority status listing after implementation of the new heart allocation policy. National variation in the rate of being listed at high priority (Status 1 or Status 2), estimated from multilevel logistic regression model adjusted for candidate level characteristics. Rates are aggregated at the Organ Procurement Organization (OPO) level, the first local level of organ allocation in the United States. Colors correspond to the estimated probability the average candidate is listed at high priority status (Status 1 or 2). Map on the left displays the expected rate of high-priority listing in each OPO, generated from applying the new allocation scheme to candidates listed between December 2016 and February 2018. Map on the right displays the case-mix adjusted rates of Status 1 and 2 listing observed at each OPO from December 2018 to February 2020, after the new allocation scheme was implemented
