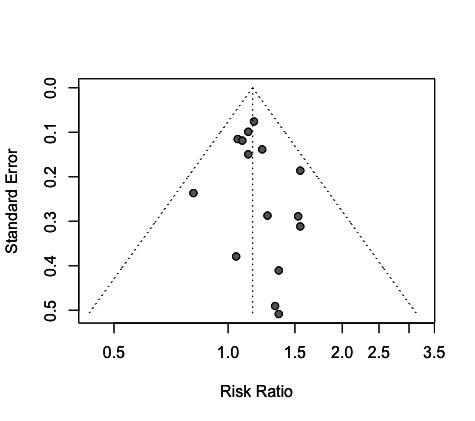
Figure 2.

Funnel plot for the effect of job strain on type 2 diabetes mellitus. For each cohort represented in Fig. 1A, the rate ratio is plotted against its standard error. Vertical dashed line: combined rate ratio estimates from Fig. 1A. The distribution is approximately symmetric, suggesting an absence of strong publication bias.
