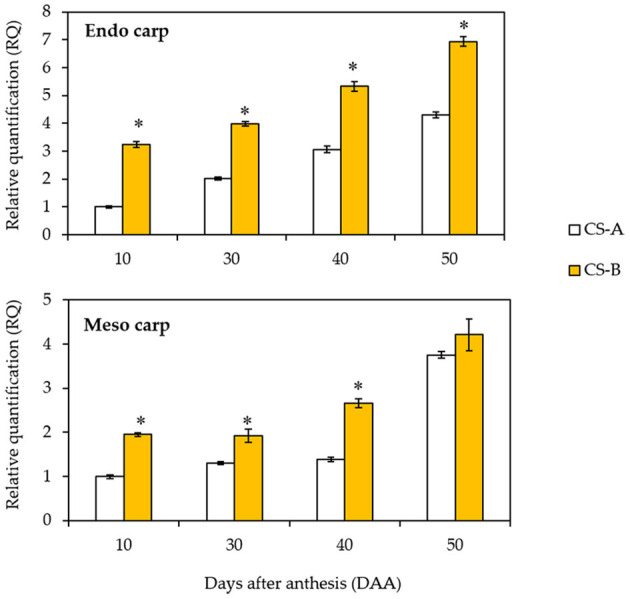
Figure 6.

Expression of CsOr gene in CS-A and CS-B in different stages of fruit development. The CsOr gene expression levels were measured by quantitative real-time PCR using the total RNAs extracted from CS-A and CS-B cucumber fruit mesocarp and endocarp tissues at the designated days after anthesis. The CsActin gene was used as an internal control for normalization. For each experiment, the expression level of CS-A at 10 days after anthesis was used as a calibrator for quantification and was assumed as 1. Error bars represent SD of mean of 3 biological repeats. *indicate statistical significance in least significant difference (LSD) test (P < 0.01).
