Figure 3.

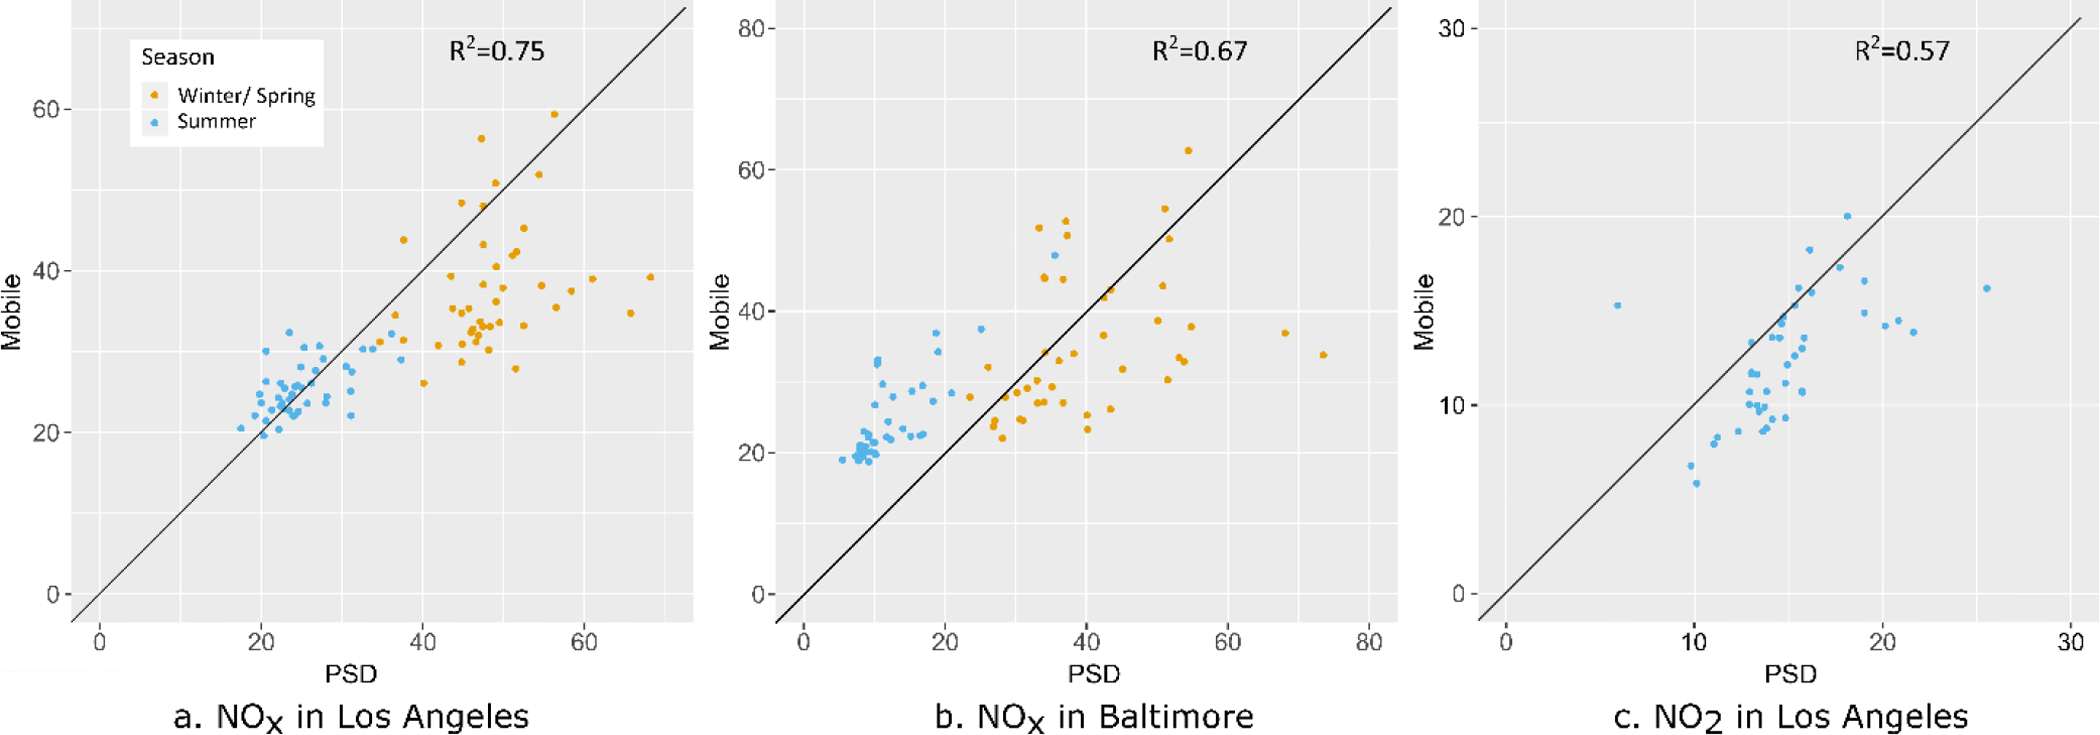
Scatter plots of PSD and mobile observations for NOx in Los Angeles (a) and Baltimore (b), and for NO2 in Los Angeles (c), at the collocated 43 sampling sites

Scatter plots of PSD and mobile observations for NOx in Los Angeles (a) and Baltimore (b), and for NO2 in Los Angeles (c), at the collocated 43 sampling sites